Disclaimer: The opinions expressed by our writers are their own and do not represent the views of U.Today. The financial and market information provided on U.Today is intended for informational purposes only. U.Today is not liable for any financial losses incurred while trading cryptocurrencies. Conduct your own research by contacting financial experts before making any investment decisions. We believe that all content is accurate as of the date of publication, but certain offers mentioned may no longer be available.
Despite the tough market outlook, XRP has found a sanctuary at the $0.5 price level. This is not just a random number; it is a robust support level that has been holding its ground for a considerable period. As of the latest data, XRP is trading at approximately $0.5001, reinforcing the significance of this price point.
Why does this matter? Well, support levels act as a safety net for investors, a point where the asset tends to bounce back rather than plummet. XRP's steadfastness around this level indicates a form of market consensus, a collective agreement among traders that this is a fair value.
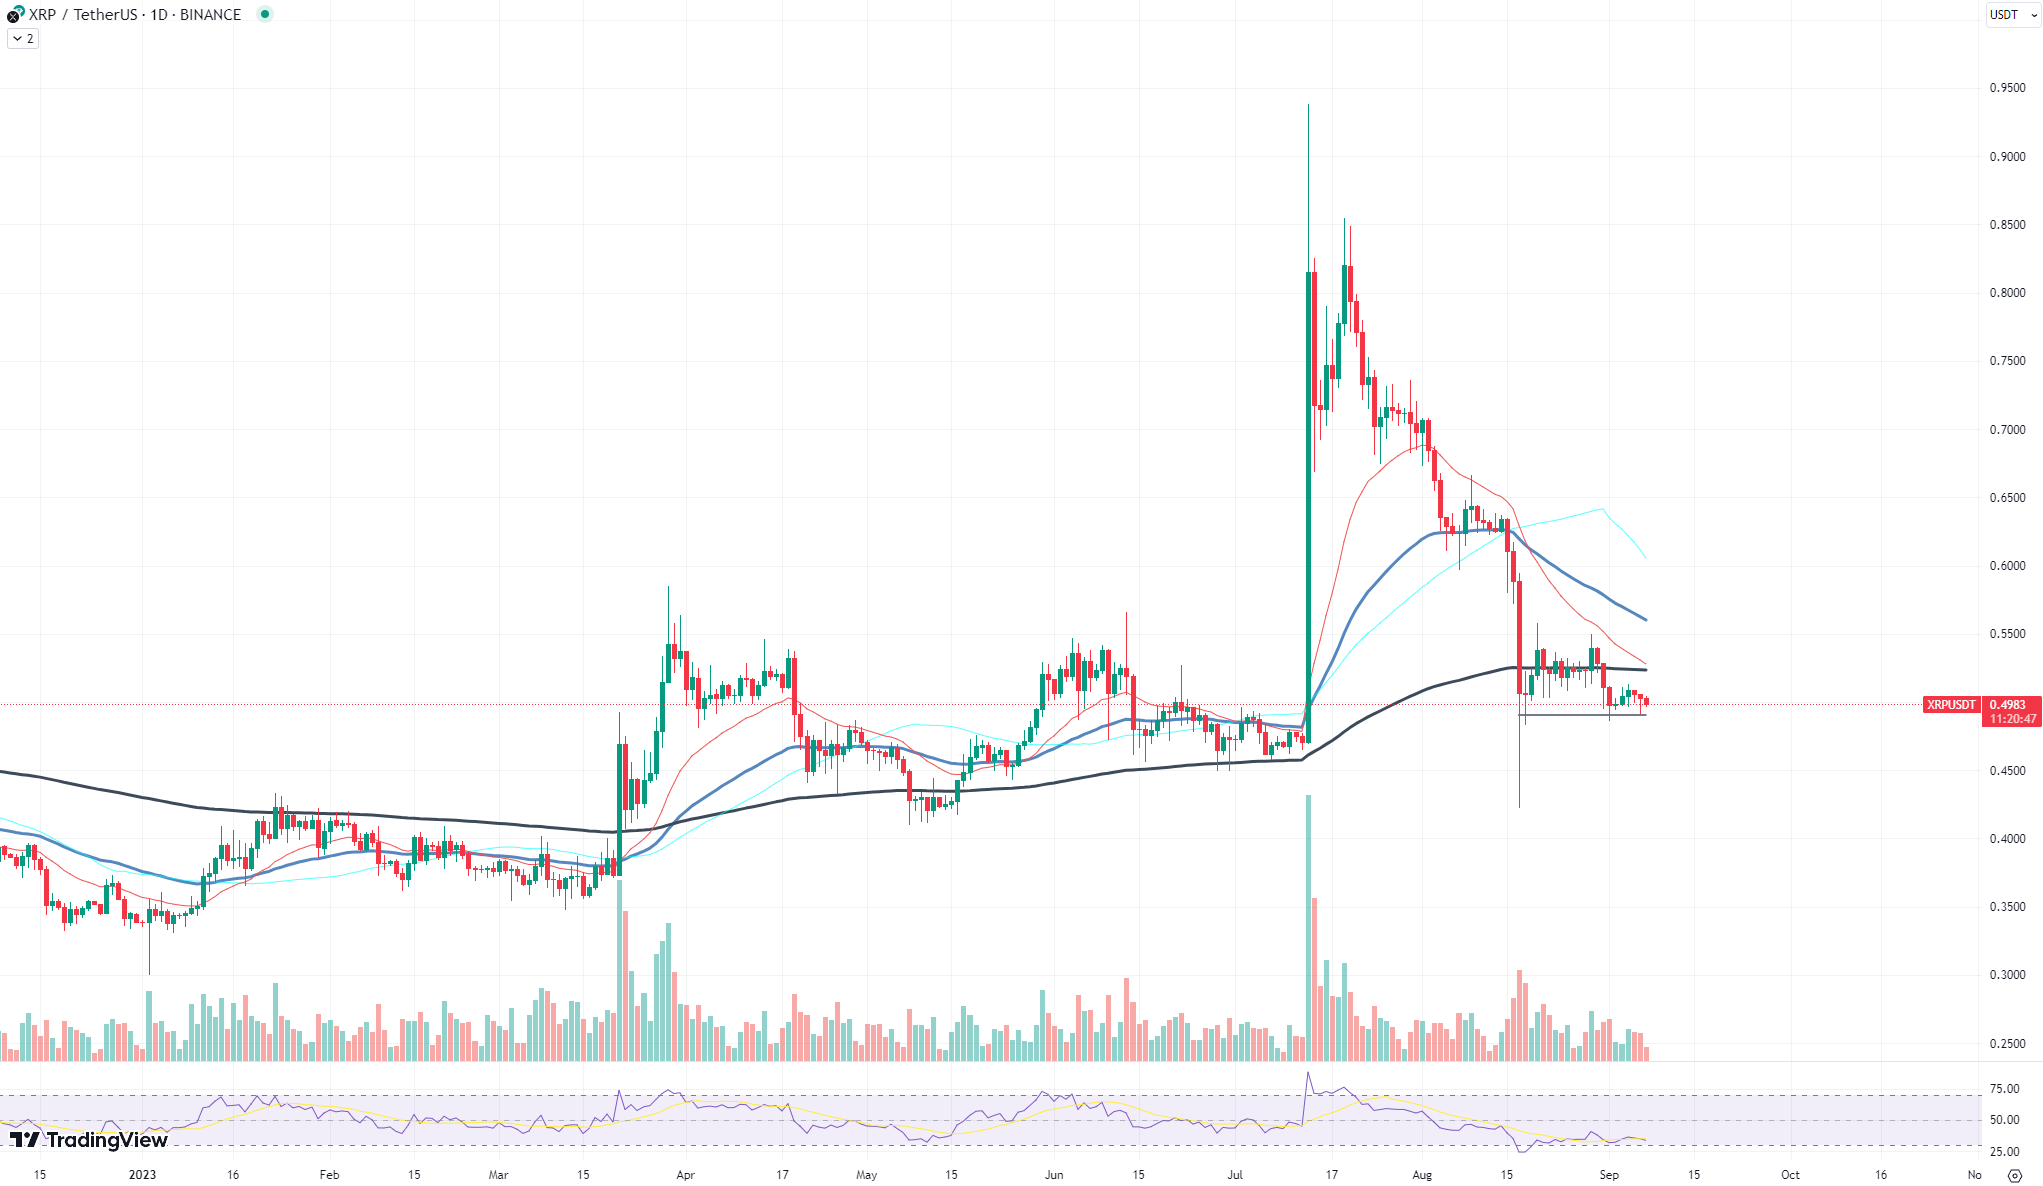
But there is another layer to this. The market is currently experiencing extremely low liquidity and trading volume. In such conditions, assets can be more susceptible to sharp price swings due to market manipulation or sudden news. The fact that XRP maintains its position despite these factors adds an extra layer of credibility to this support level.
What's the takeaway? If you are an XRP holder or considering becoming one, this $0.5 level is something to keep an eye on. It is a point of stability in an otherwise volatile market, and it could act as a launchpad for future gains, especially when trading volumes pick up.
Ethereum is sleepy
Ethereum, the blockchain often hailed as the backbone of the DeFi universe, is currently experiencing a startling dip in network activity. This is not just a blip on the radar; it is a seismic shift that is rippling through the entire DeFi sector. The usually bustling Ethereum network has turned eerily quiet, and this lull is raising eyebrows.
Now, let's talk numbers. The drop in network activity is not just a vague notion; it is a measurable decline that is impacting the DeFi sector, which has been Ethereum's crowning glory. This downturn is not operating in isolation; it is dragging Ethereum's price volatility down with it. Yes, you read that right. Ethereum's price is not just stable, it is stagnant, with volatility dropping to an extreme low.
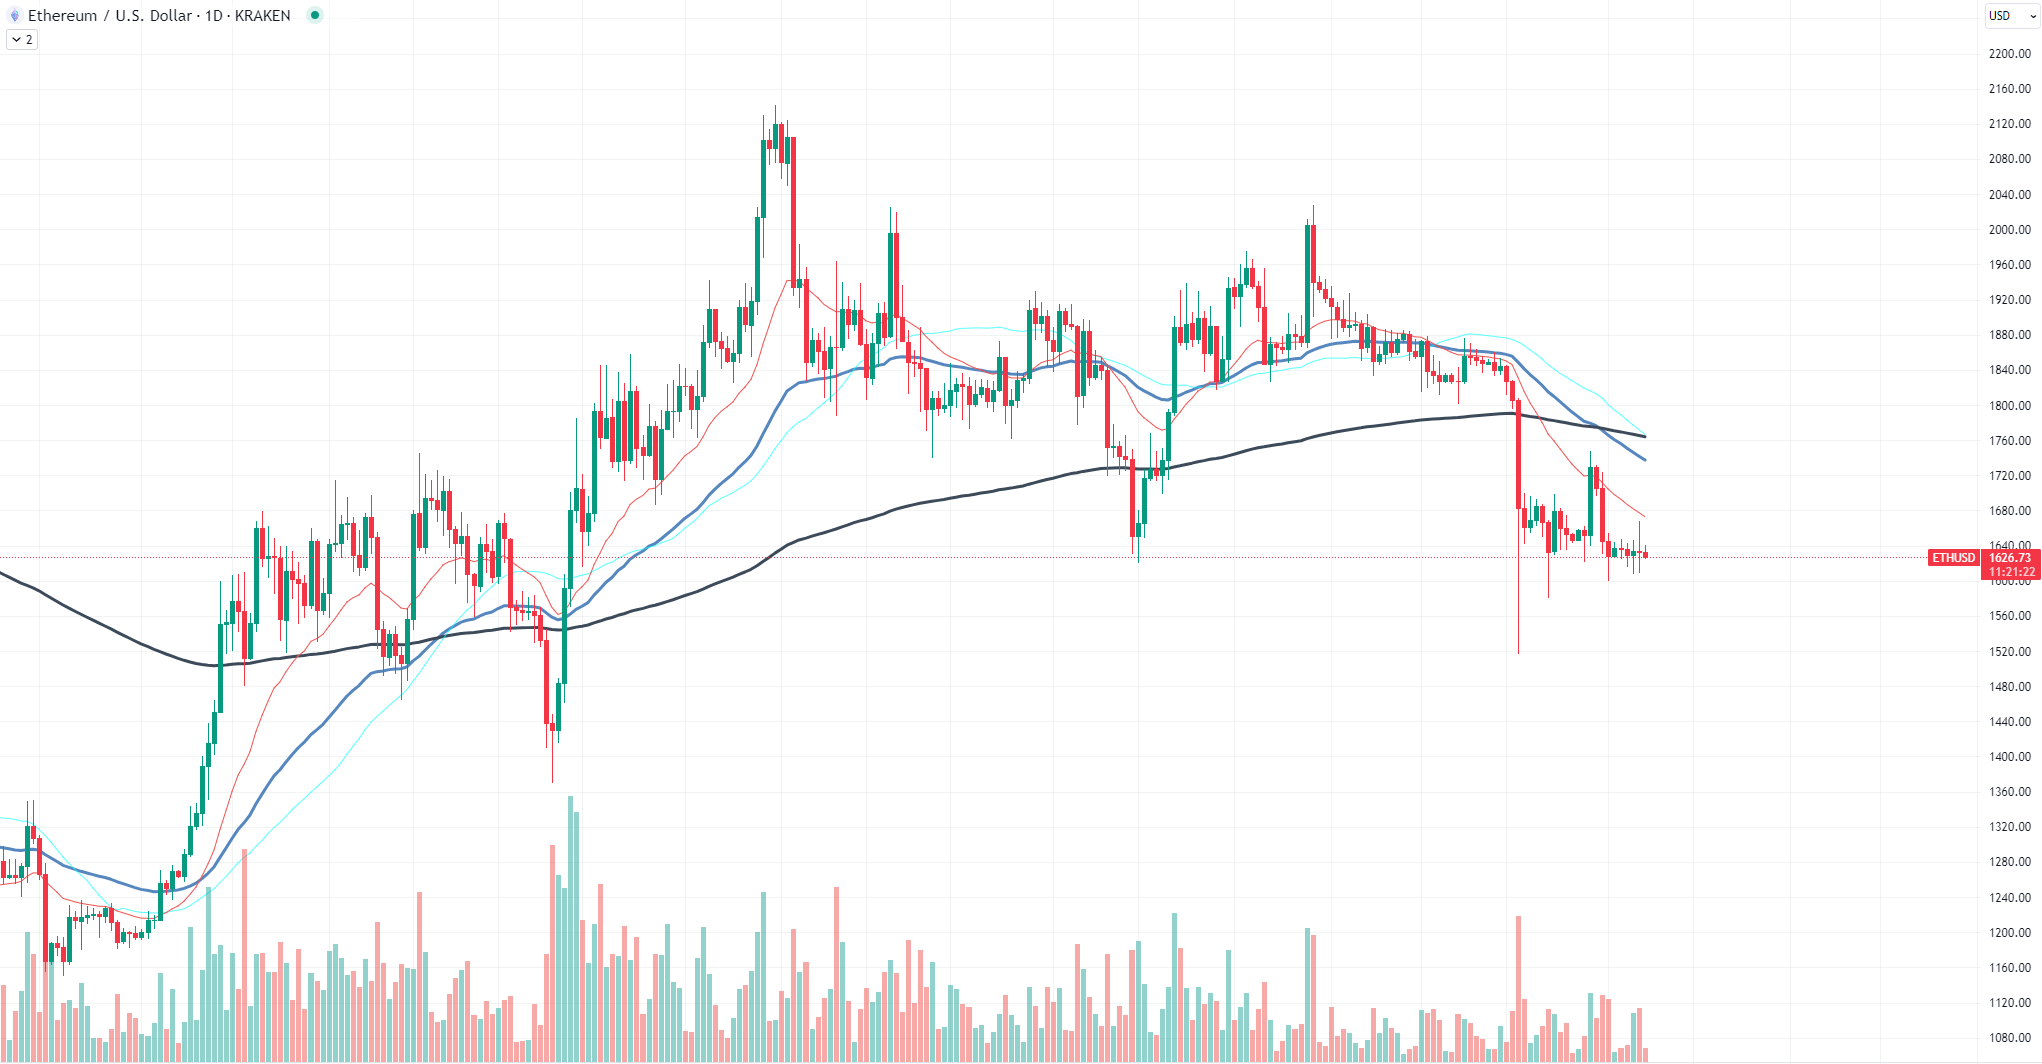
So, what is the culprit behind this sudden tranquility? Look no further than the current liquidity drought in the crypto market. Liquidity is the lifeblood of any financial ecosystem, and right now, it is scarce. This liquidity void is not just affecting trading volumes but also stifling the usual ebbs and flows that give life to price charts.
Why should you care? Well, low volatility might sound like a good thing, but it is a double-edged sword. On one hand, it reduces the risk of sudden price crashes, but on the other, it also caps the potential for quick gains. In a market that thrives on speculation and quick moves, this could be a deal-breaker for day traders and short-term investors.
Solana is riding waves
Solana's price chart is starting to look like a surfer's dream — wave-like patterns are the new norm. The cryptocurrency has been oscillating between the 21 and 50 Exponential Moving Averages (EMAs), only to retreat back to the trend's support level. This rhythmic motion has caught the eyes of traders and analysts alike, but what does it signify?

As of the latest data, Solana (SOL) is priced at $19.55. The wave-like price movements are not random; they are a dance between bullish and bearish sentiments. When SOL approaches the 21 or 50 EMA, it is often a sign of bullish momentum. However, the pullback to the trend's support level indicates that the bears have not left the building. This tug-of-war creates a wave-like pattern, offering traders multiple entry and exit points.
Why should you care about these waves? Well, they are more than just pretty patterns. They offer insights into market psychology. When SOL climbs towards the 21 or 50 EMA, it indicates that traders are optimistic, possibly expecting upcoming positive news or developments. The retreat back to the support level, on the other hand, suggests caution, perhaps due to market uncertainties or external factors.
The wave-like behavior also hints at a more stable trading environment for Solana. Unlike assets that shoot up dramatically only to crash just as hard, SOL's wave-like pattern suggests a more calculated approach by traders. It is as if the market is taking a "two steps forward, one step back" strategy, which, while slower, is often more sustainable in the long run.
 Dan Burgin
 U.Today Editorial Team