
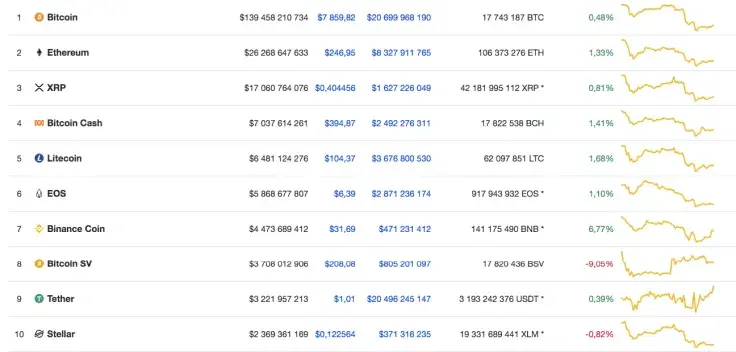
The situation on the cryptocurrency market is being changed very fast; if yesterday most of the coins were in the red zone, today, only Bitcoin SV and Stellar Lumens are losing their value out of the top 10 coins. Such a slight bounce back pushed the market capitalization to the crucial $250 bln level.
Analyzing the reasons of the recent 2-day correction, it was mainly caused due to the pressure from big market players and the influence of the US and Chinese trade wars, prompting investors to get rid of high-risk assets.
However, from a technical point of view, the market has adjusted before the upward movement. Moreover, round values are often considered as severe psychological levels. Therefore, the recent Bitcoin rebound from $9,000 is not unusual.
BTC/USD
Even though the price of Bitcoin has increased by only 0.4% over the previous day, its quotes are trading according to our recent forecast, moving to the critical resistance at $8,000.
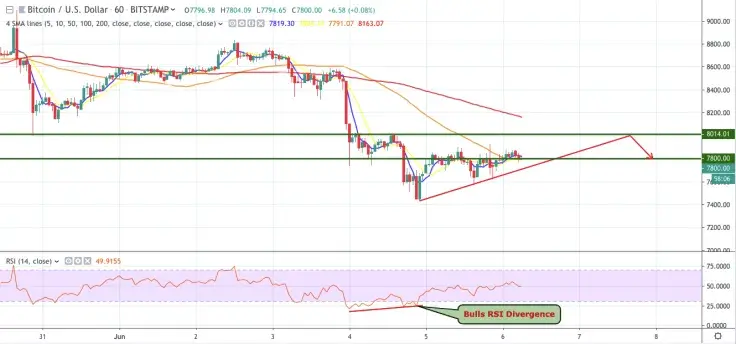
Buyers' dominance is observed on the hourly time frame: RSI shows a bullish divergence, signaling the likelihood of short-term recovery of BTC to $8,000.

However, taking into account the situation on the previous charts, after the upward correction, the price decline is likely to continue to the area of $7,800.
The price of BTC is trading at $7,800 at the time of writing.
ETH/USD
The second crypto by capitalization has adjusted as we predicted earlier, and at the moment there is a rebound from the lower border of the Bollinger Bands indicator. This can be a good signal for continued growth. As one can see, earlier, this test provoked an increase from $145 to $280. The current situation looks similar, so we should expect an attempt of a sharp rise in the cryptocurrency’s quotes.
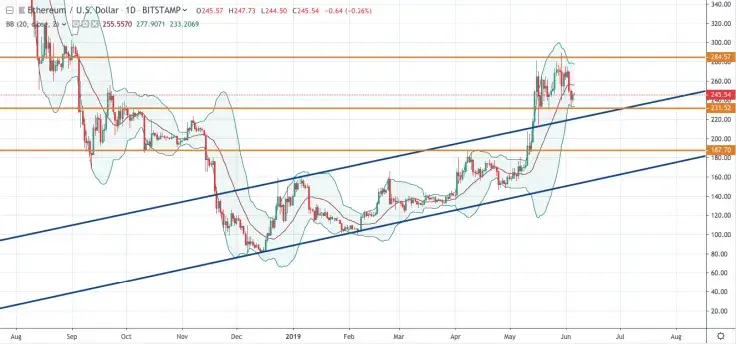
An additional positive signal is the fixing of quotes above the upper boundary of the ascending channel. The growth target will be at a distance equal to the width of this corridor.
The price of ETH is trading at $245.54 at the time of writing.
XRP/USD
On the hourly chart, XRP quotes are trapped within the Triangle pattern; there is a decrease in volatility in front of a strong movement.
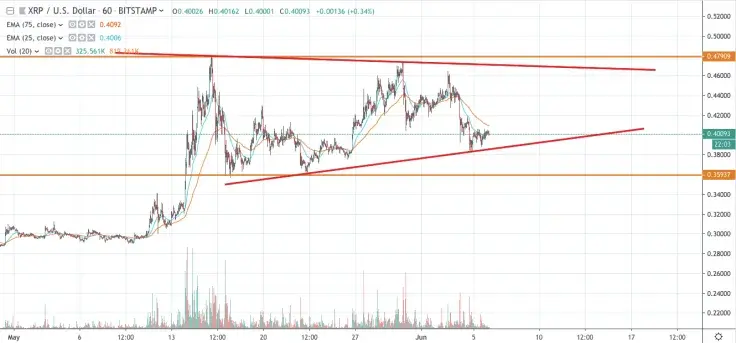
As the main trading idea, we can expect Ripple to test the lower boundary of the triangle model and then rise to its upper boundary. In the case of its breakdown and consolidation above the level of $0.4790, one should expect continued growth to the target at $0.5875. The basis for determining the end point of the movement of quotes is the height of the geometric pattern.

The price of XRP is trading at $0.4015 at the time of writing.
 Dan Burgin