*** Please note the analysis below is not investment advice. The views and opinions expressed here are solely those of the author and do not necessarily reflect the views of U.Today. Every investment and trading move involves risk, you should conduct your own research when making a decision.
Bitcoin is above U.Today’s mentioned resistances
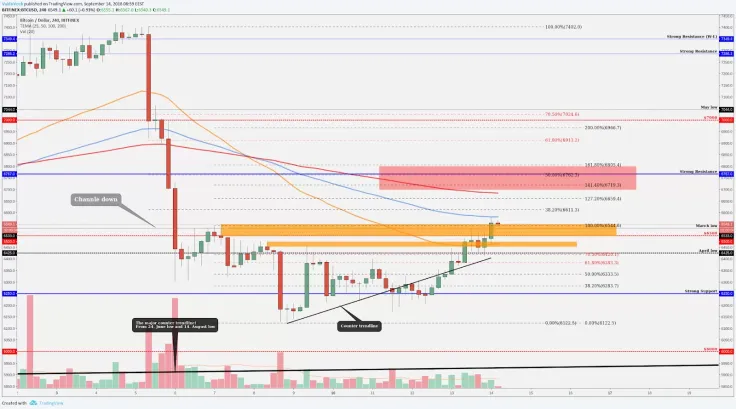
Yesterday, we said that Bitcoin shows some bullish volume and it shows some strength to go upwards. Currently, the last four-hour candle close was exactly above our last marked resistance area at $6,550 which means that we have a breakout from the strong resistances and now, starts to play our next previously mentioned resistance level at $6,700-$6,800. In this level zone, the price could turn around and be bearish again.

It is technically a good short opportunity because technically, our bias is bearish based from the previous week candle close which was bearish "Engulfing.”
$6,700-$6,800 area short criterias are:
-
The Fibonacci retracement 50 percent (pulled from Sept. 5 to Sept. 8)
-
The Fibonacci extension 141 percent to 161 percent (pulled from Sept. 7 to Sept. 8)
-
Strong resistance area $6,787-$6,800
-
200 EMA starts to work as a resistance
We also might see a throwback from the bigger Fibonacci 38 percent level around $6,600 On the four-hour chart, we meet with the 100 EMA line. 38 percent is also important because if the pressure is down (currently the long-term pressure is down) then from this level we could see a bigger throwback but let’s see!
Currently, the last candle close and the price structure shows us positive signs and our main aim is still $6,700-$6,800 if we climb higher, there we want to search some bearish price action (candlestick patterns, chart patterns on the lower timeframes, minimum 15 min, volume) before we start doing anything.
Ethereum (ETH/USD) one of the top gainers in the trendline party
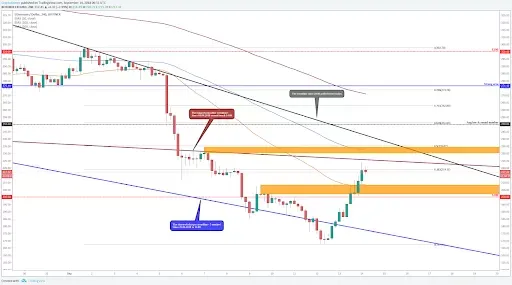
Ethereum has made a 33 percent increase since Sept. 12, it bounced upwards from $170 and now the current price is around $215. The bounce came from the sharper trendline area. After the bounce, we got from the daily timeframe a nice bullish candlestick pattern called "Morning Star" and this momentum gave a boost to break back above the blue trendline, above the $200, above the orange resistance level, above the 50 EMA (on the one- hour timeframe it trades above all the EMA's - 50, 100, 200).

Currently, the price sitting on the Fibonacci retracement level 38 percent and it approaching the trendline (dark red) which is pulled from April 1, 2018 and could start to work as a resistance. Above the current price are heavy resistances after another:
1. The longer and smoother trendline since April 1, 2018- $225
2. Previously worked resistance- $230-$234.5
3. Fibonacci retracement 50 percent- $235
4. The trendline since July 29 - $237-$241
If we can beat those levels then the Ethereum panic selling could be over.
Cardano (ADA) looks like the massive fall is over (-43 percent)
"At the moment we trade above the major down-trendline but if we go and retest this trendline then we go and test pretty low levels. Depends how fast we go and make the retest but we may go as low as $0.062."
Those were our words at Sept. 6., Cardano made a massive drop (-43 percent since Sept. 5) and it touches our mentioned level almost perfectly.

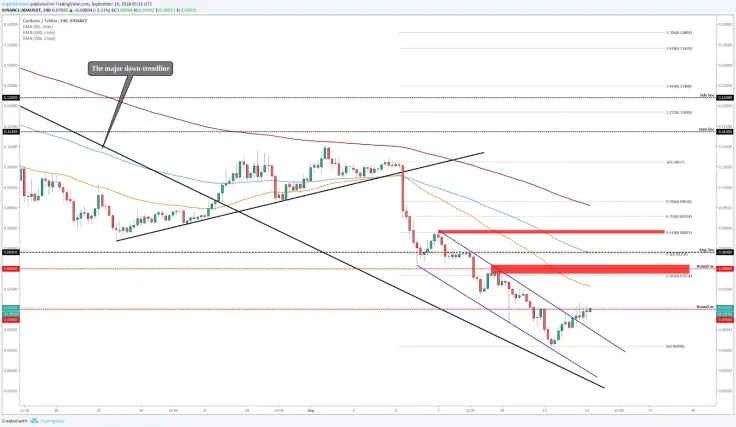
Cardano got a bounce from $0.061 and currently, it fights with the round number $0.07. We have attempted to break through from this level but all those attempts were unsuccessful and sellers pushed the price back below the $0.07. At the moment we are trying for the fifth time to break above this round number and let's see what we got after four-hour candle close.
Signs are bullish because yesterday we made a breakout from short-term down trendline (blue upper trendline) which will indicate that the price structure should be changing and we can make higher highs. We slowly start to catching up some EMA's and in the one-hour chart, we trade above the 50 EMA and most importantly Bitcoin shows also bullish signs.
If Cardano breaks the round number then our targets are based on Fibonacci retracement levels (pulled from and previous support levels: Sept. 5th to Sept. 12th):
1. Around $0.08 - like you see from the current example the round number starts to work as resistances, in this area, there is also the Fibonacci retracement level of 38 percent and strong support/resistance area (red box).
2. Around $0.089- in this area, we have a previously worked resistance level and the perfect Fibonacci retracement level of 62 percent.
Hopefully, those levels and this analysis helped you out a little bit to confirm your own analysis.
 Dan Burgin
 U.Today Editorial Team