Disclaimer: The opinions expressed by our writers are their own and do not represent the views of U.Today. The financial and market information provided on U.Today is intended for informational purposes only. U.Today is not liable for any financial losses incurred while trading cryptocurrencies. Conduct your own research by contacting financial experts before making any investment decisions. We believe that all content is accurate as of the date of publication, but certain offers mentioned may no longer be available.
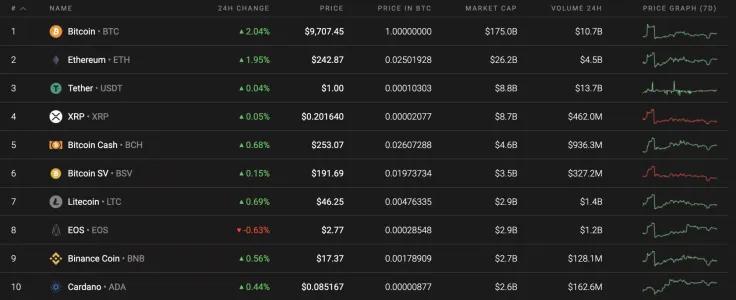
By the second part of Monday, most of the top 10 coins have recovered from the fall over the weekend. However, EOS is the exception to the rule. The rate of this coin has fallen 0.63% over the past day.
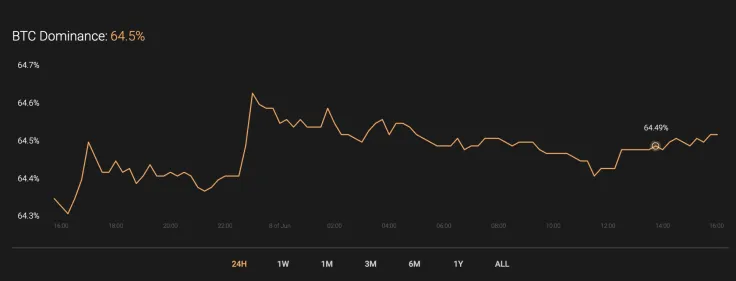
The BTC dominance rate also keeps gaining strength and is currently at 64.5%.
The relevant data for XRP is below.
-
Name: XRP
Advertisement -
Ticker: XRP
-
Market Cap: $8,947,062,390
-
Price: $0.202822
Advertisement -
Volume (24h): $1,126,818,360
-
Change (24h): 0.16%
This data is relevant at press time.
XRP/USD: Should we expect a blast off soon?
On Sunday, sellers sold a narrow sidewall at the level of average prices and tested the support at $0.20. In the afternoon, buyers reacted by restoring XRP to the two-hour EMA55 and this morning the pair has continued to consolidate in the same narrow range.
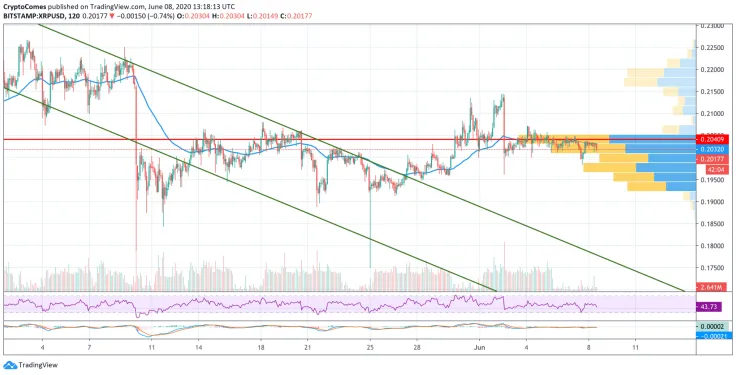
All of the efforts of buyers are limited by the Point Of Control (POC) indicator line ($0.204). If purchases don't increase, then during the day, the pair will remain on the narrow side. A break out from the POC line may lead to a resistance re-test at $0.213.
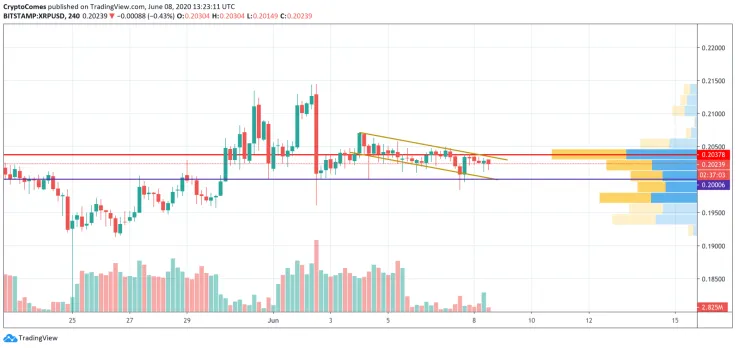
On the 4H chart, XRP is trading within the descending channel, supported by low trading volume. Even though most of the coins are in the green zone, the third most popular crypto is under bearish pressure. In this case, there is a high probability of seeing the coin at the bottom level of the channel at $0.20 within the next days.
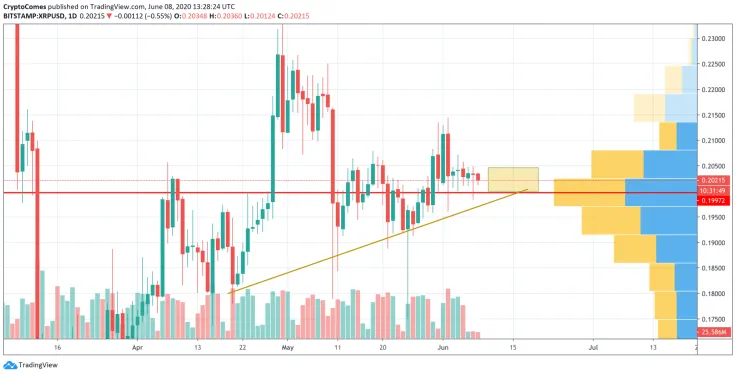
On the bigger time frame, daily candles are small, confirming the unwillingness of buyers and sellers to make moves.
The trading volume is low. However, the high level of liquidity is focused in the current zone. Respectively, a more likely scenario for XRP is trading in a sideways trend until the end of the week in the yellow range between $0.20 and $0.205.
XRP is trading at $0.2021 at press time.
 Dan Burgin