
At night, the rollback started on the market, however, the overall capitalization did not decrease too much. In the short term, rates can still grow, but the main thing is not to miss the return of bears, who can sharply push the positions of bulls.
Taking into consideration a number of tools, the technical part already looks like the beginning of a new cycle and the development of the bullish phase, but, most likely, it is wishful thinking.
The market capitalization is $174 billion.
XRP/USD
Last night, Ripple turned around at a maximum of $0.375 and, while falling, tested the support of $0.330. Buyers could restore the price to the vital point of $0.345, but bears renewed pressure and clearly wanted to test the level of average prices – $0.320.
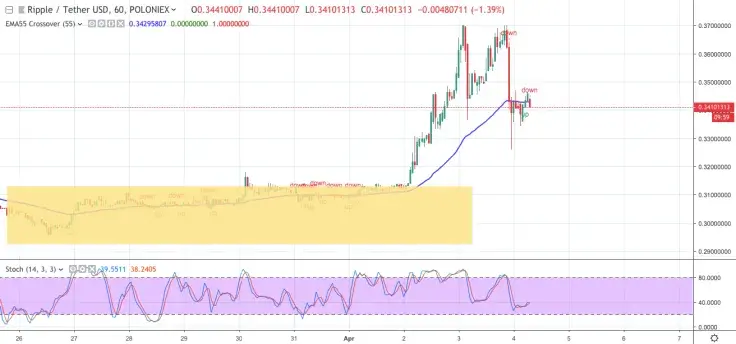
If the moving average EMA55 does not hold a bearish pressure, then rates will return to their previous levels from which the bullish race has started – the upper limit of the yellow corridor (0.311 USD).
The price of XRP is trading at $0.3410 at the time of the writing.
BCH/USD
Analyzing the daily chart of Bitcoin Cash, we see that the upward impulse has reached the resistance line of the correction channel and the level of 38.2% Fibonacci relative to the previous long wave of decline.
A break of support at $143 will be a signal to reduce and update key minimums. The MACD indicator demonstrates stability and potential for further growth within its dynamics.
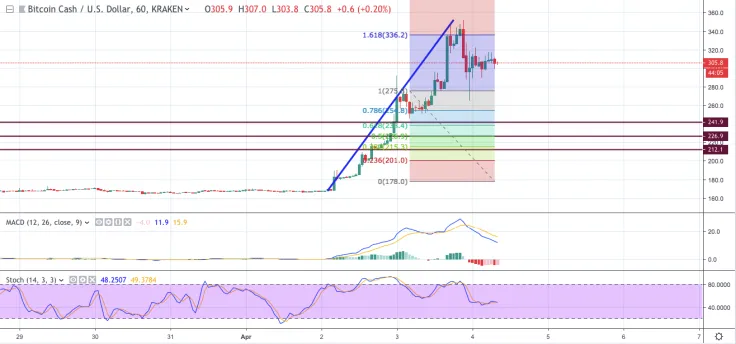
The 1-hour timeframe, like other tools of the cryptocurrency market, shows a bouncing rollback after reaching the resistance line. The correction has achieved the level of 23.6% and can continue to the points of 38.2% ($241.85), 50.0% ($226.96) and 61.8% ($212.08) on the Fibonacci scale. At the same time, Stochastic formed the “Black Cross”, which confirms the short-term corrective decline.
The price of BCH is trading at $304.48 at the time of the writing.
LTC/USD
The dynamics of Litecoin quotes on the daily chart show a rapid growth trend, which can create the impression of a reversal of a long-term downtrend, but so far this is only a correction from the previous wave of decline. A short-term goal may be local support at $71.40, while the primary one is at $60.20.
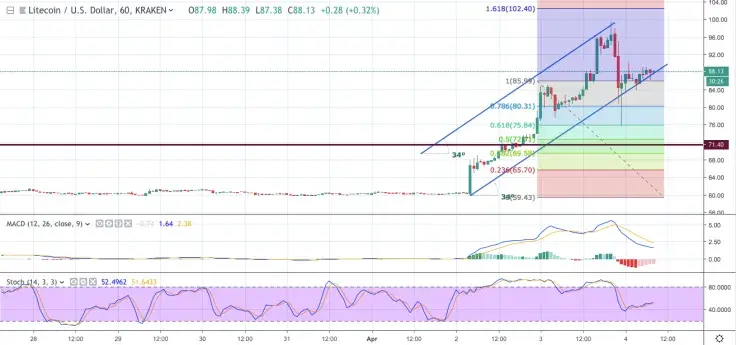
The correction targets are at Fibonacci levels of 38.2% ($75.30), 50.0% ($72.30) and 61.8% ($69.33). Resistance is at a maximum of $84.98.
The price of LTC is trading at $87.86 at the time of the writing.
EOS/USD
Analyzing the technical analysis of EOS on the daily chart, you can see that pushing off from the level of $1.55 after convergence on the MACD, the cryptocurrency develops another growth impulse.
If this scenario is implemented, it will be a signal of a long-term bullish trend in the new cryptocurrency life cycle.
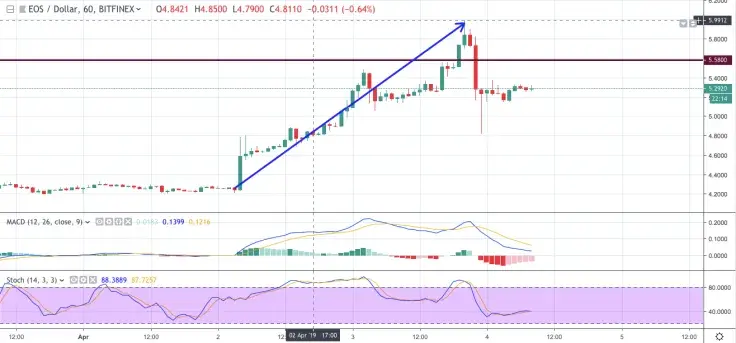
The short-term target is located on the resistance line of the current corridor – the mark of $5.58. The observed formation of divergence on the MACD indicator may indicate a pullback approach.
The price of EOS is trading at $5.2 at the time of the writing.
 Dan Burgin