Congratulations, Bitcoin! You’ve made the impossible - $6,000 target is reached for good. But where the props and acclaim from traders? Why then they are still skeptical? Let’s read Bitcoin price predictions from TradingView experts to find out what people really think about BTC future.
Get prepared for the bright future

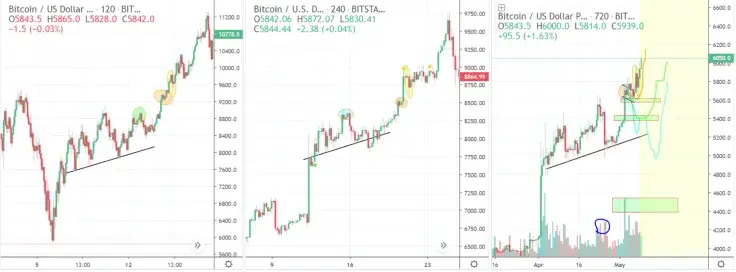
One of the most popular TradingView experts, botje11 had recently come up with a few predictions based on the previous BTC rallies (you can see those on the chart). There used to be three versions:
- The orange one is the most bullish version. This means the bull flag we are in at the moment, has to stay intact. It implicated maximum drop to $5,580 and then completing the bull flag.
- The blue one implemented a shocking move. Seeing a big violent dump, trigger stops of long positions to fuel a dump, turning sentiment to bearish again. Then after a small bear trap at the low, turning the market around again and continuing the rally.
- The green one was less likely because we have a clear higher high.
Turned out, the orange version has accentuated. It dropped a bit more than expected with a quick dump that happened in seconds. But eventually, it went up again like nothing was wrong.
Comparing the current situation with the previous 2 rallies, we can see it's likely that we are in the yellow circle now. This means that we need to stay above $5,700.
Yesterday we had the Binance hack news, the market dumped but it's already back up like nothing is wrong. Just like with the Bitfinex issue a few weeks ago. The market clearly is not impressed by all this.
Whales and bulls are doing everything possible to sustain the BTC price. If this theory is right, we should expect that if they fail and the market starts to drop, they might cave in and dump it all and see one hell of a dump. Botje11 thinks it won't happen until the $4,800/5,100 level breaks.
Yes, this time, altcoins are a bit weaker compared to BTC, that’s why this market will dump again eventually, but for now, we will see another rally before that happens. We need a bigger sell volume candle before we think this rally is already over.
Wait for bearish confirmations

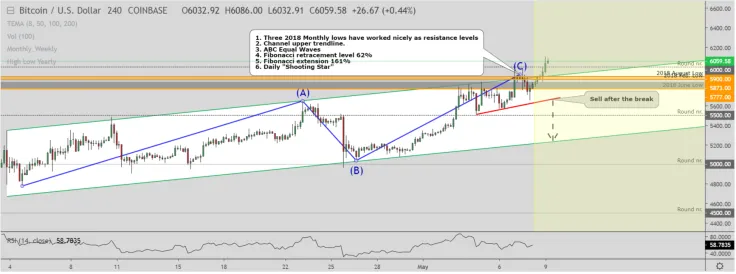
As VaidoVeek indicated, yesterday the price reached almost to the $6,000 but it didn't get a close above the August low at $5,900. Five rejections from the mentioned resistance and the day got an end below the all of those marked Monthly lows plus below the Fibonacci 62% retracement level.
He states that the resistance is too strong, and this suggestion is based on the technical indicators. Here’s what we have:
-
During the 3 last years, monthly lows have worked nicely as resistance levels.
-
Multiple times worked ascending channel upper trend line runs through the $5,900 which should work as a resistance.
-
ABC Equal waves counting ends around the $5,900.
-
Fibonacci retracement level 62% has worked nicely as resistance, especially on the Daily timeframe.
-
A bit sloppy Fibonacci extension 161% is around the $5,900.
-
May 8 Bitcoin price touched those all criteria, got a rejection and this rejection and the day ends with a bearish candlestick pattern called "Shooting Star"
Obviously, the market is on the heavy bullish mode but the resistance is also too heavy. Thus, it looks like a pretty decent sell setup considering that area and considering the Daily bearish candle.
However, it’s a little bit hesitating because of the current consistency. It can drive the price above those orange lines, and above the heavy resistance of $6,106.
Weekly resistance will open the gates for bears

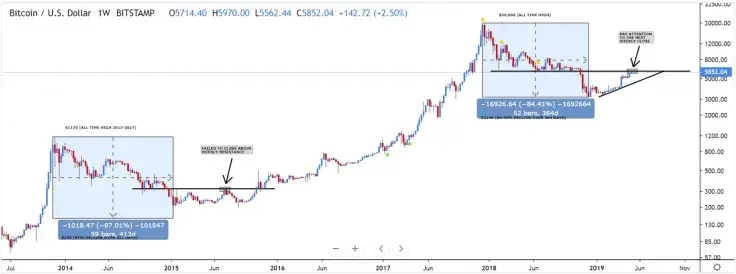
This user decided to perform a comparison between the current and previous bear market because there are a lot of similarities between both cycles that we can use to our advantage.
For example, from 2013 to 2015, BTC dropped from $1,170 to $150 resulting in a decline of 87% which lasted 413 days. From 2017 to 2019, BTC dropped from $20,000 to $3,140 resulting in a decline of 84.40% which lasted 364 days.
The percent of decrease and time period are extremely similar in both cases, and when we take a look at the current price action for BTC, it holds a similar structure.
The current resistance tested by BTC is much stronger than before, this support level held for 9 months with at least 5 separate tests in which it finally broke during November 2018. It is highly likely BTC will fall short at this weekly resistance level and history will repeat itself, the bulls will be put back in their place (for now) and we'll experience a minor correction and even see a drop in price by 37.7%, or a smaller correction of 20%.


 Alex Dovbnya
 Arman Shirinyan
 Dan Burgin