Disclaimer: The opinions expressed by our writers are their own and do not represent the views of U.Today. The financial and market information provided on U.Today is intended for informational purposes only. U.Today is not liable for any financial losses incurred while trading cryptocurrencies. Conduct your own research by contacting financial experts before making any investment decisions. We believe that all content is accurate as of the date of publication, but certain offers mentioned may no longer be available.
The Shiba Inu (SHIB) token appears to be experiencing a turnaround. On-chain data indicates a significant shift in the behavior of cryptocurrency whales, the market's big players. Notably, the large transaction count for Shiba Inu is tapering off, while the price is either ascending or entering a consolidation phase. This pattern suggests that the recent market sell-off was driven by these whales cashing in on their investments.
A closer look at the Shiba Inu chart reveals a telling story. After a period of heightened activity, which is often associated with large holders, or "whales," actively buying or selling, there is a visible decrease in volume. This decrease in volume corresponds with the stabilization of the price, hinting at reduced sell pressure. During the sell-off, the price dipped sharply, but it has since recovered and is showing signs of an uptrend or stabilization at current levels.
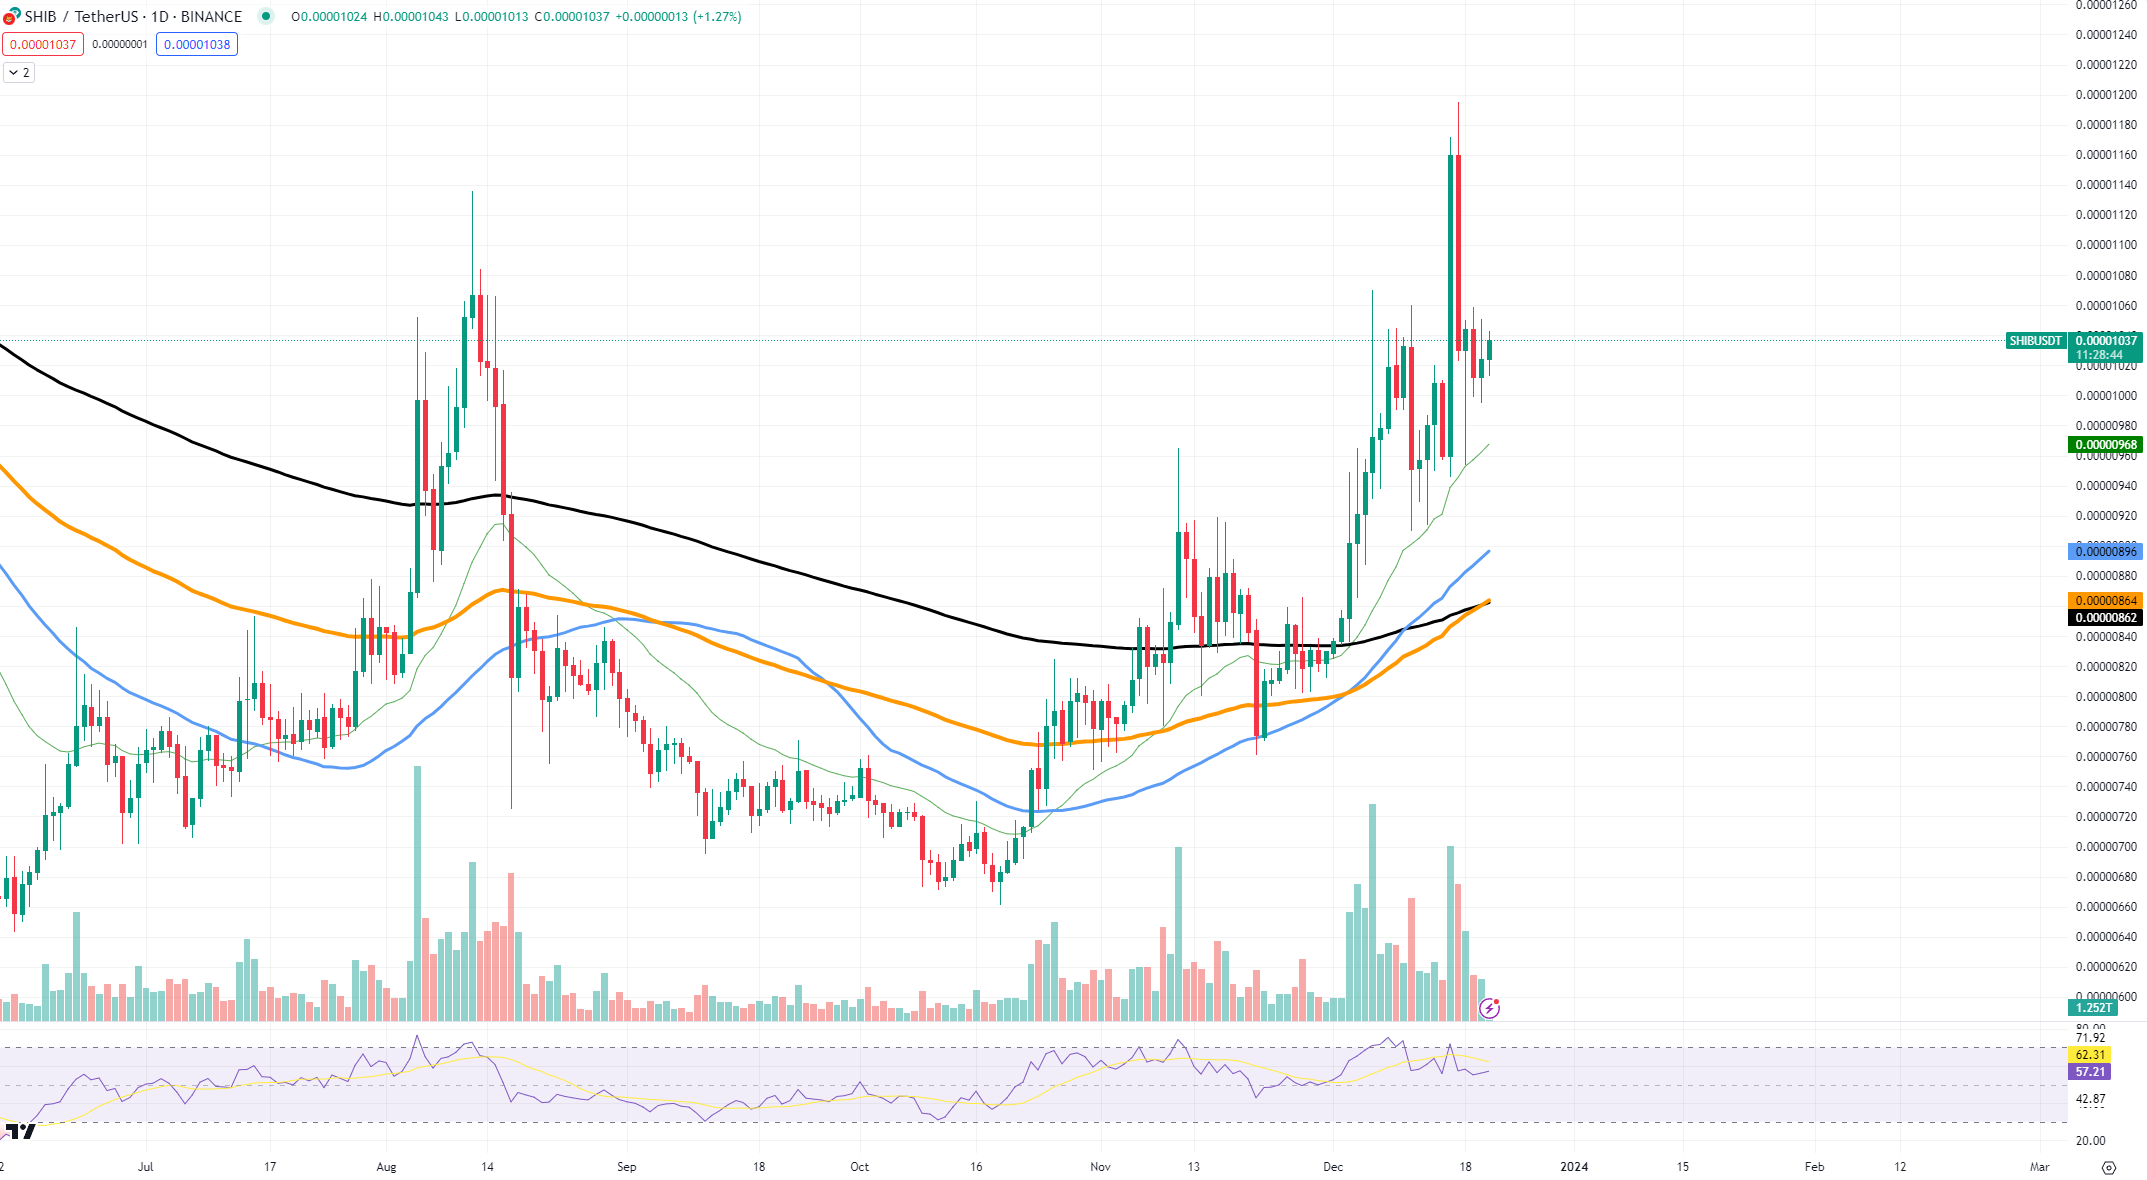
The chart presents a bullish candlestick formation, indicating a possible reversal of the previous downtrend. The Moving Average (MA) lines – the 50-day (orange), 100-day (blue) and 200-day (black) – are trending upward, which is traditionally interpreted as a bullish signal. The 50-day MA is positioned above the 100-day and 200-day MAs, reinforcing the bullish sentiment.

Another technical indicator, the Relative Strength Index (RSI), which measures the magnitude of recent price changes to evaluate overbought or oversold conditions, is hovering around the 50-60 range. This level is typically seen as a neutral zone, suggesting that SHIB is neither overbought nor oversold at the moment.
The price consolidation after a surge often indicates that the market is agreeing on a new value for the token, following whales' profit-taking. It is a crucial phase where the token can either prepare for another leg up or face resistance and possibly a retracement.
 Dan Burgin
 U.Today Editorial Team