Currently occupying the number 4 spot in market cap rankings, with a circulating supply valued at $3,694,007,591, Litecoin is one of the oldest cryptocurrencies and the original “fork” of Bitcoin. It is a lighter-weight, faster-version of Bitcoin and focused specifically on P2P financial transactions.
● Litecoin reached its all-time high in 2017 with most of the climb generated by its ability to adopt and implement new features like Segregated Witness and the Lightning Network before its “big brother” Bitcoin.
Litecoin has had its fair share of controversy (which coin doesn’t) but this was mostly due to its creator, Charlie Lee, selling out of his Litecoin holdings almost at the peak of the Crypto Bull Run. This led many to believe that he is no longer interested in developing the coin and that he is preparing an exit, but those fears are contrary to everything Lee has said in the interim. What's happening now? Litecoin is climbing the CoinMarketCap rankings and constantly announcing new partnerships and features.
LTC/USD Price Analysis – The Big Picture
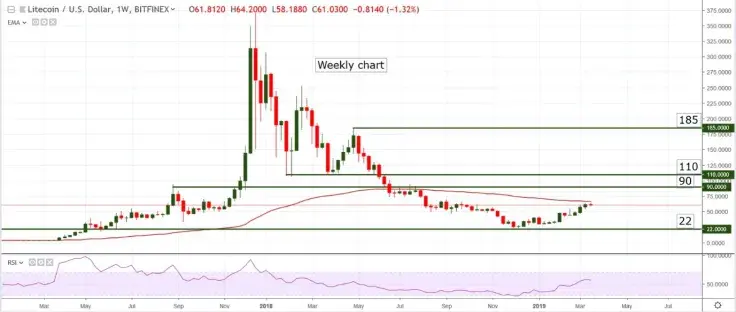
Litecoin is trading at roughly 60 against the US Dollar, which is actually very good considering that in December 2018 it was trading at $24. Judging from a technical chart perspective, this climb makes it one of the most prolific coins of 2019 so far.
In late 2018 – early 2019 the price started to show increased bullish pressure after a bounce at $22 - $24 support. The current climb could easily extend into the area near $90 as the Relative Strength Index is showing a nice upwards angle without being overbought. The candles are full-bodied, which is a sign of healthy price action, with good volume so it looks like pretty good action to me.
At the moment the pair is facing a strong resistance represented by the 100 weeks Exponential Moving Average (red line on the weekly chart above). If there’s any chance to see a climb into $90 - $110 this barrier must be broken. Minor retracements are possible in the near-term but for an uptrend to develop the EMA must be surpassed and the candle must close above it.
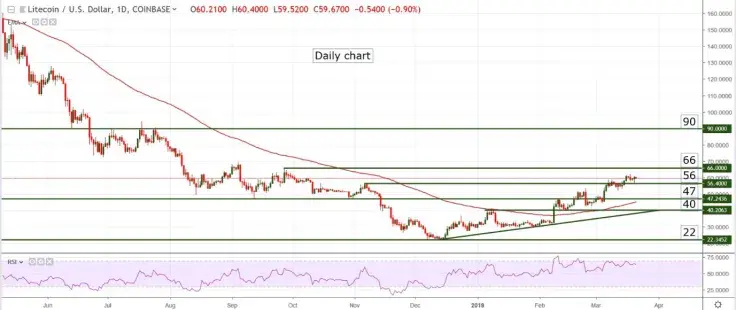
On a Daily chart, the price is well above the 100 days EMA and is supported by a solid bullish trend line. However, the Relative Strength Index has been poking through its overbought level (70) so it’s pretty safe to assume that a pullback is developing and a good place for that to happen is the resistance area around $66 - $69. As long as the pair remains above the 100 days Exponential Moving Average, the pair is still bullish from a medium-term perspective.
Daily Chart Support: $56; $47; 100 days EMA; $40
Weekly Chart Support: $22 and all-round numbers below the current price
Daily Chart Resistance: $66 - $69; $90; $100 (psychological level)
Weekly Chart Resistance: $90; $110 (this was support in the past, so it can act as resistance but it is not confirmed yet); $185 (in the long run)
Most likely scenario: minor retracements en route to $90 - $100 where a deeper pullback may be seen
Alternate scenario: price action slows down, pair loses direction and starts ranging


 Tomiwabold Olajide
 Caroline Amosun