

About a year ago, Ethereum was trading at $1,300 - $1,400, and today it hit a low of $121. It also lost second place in the market cap race to Ripple’s XRP, and it seems the overall negative sentiment surrounding cryptocurrencies is hitting ETH worse than initially believed.
Charts at a Glance — ETH/USD
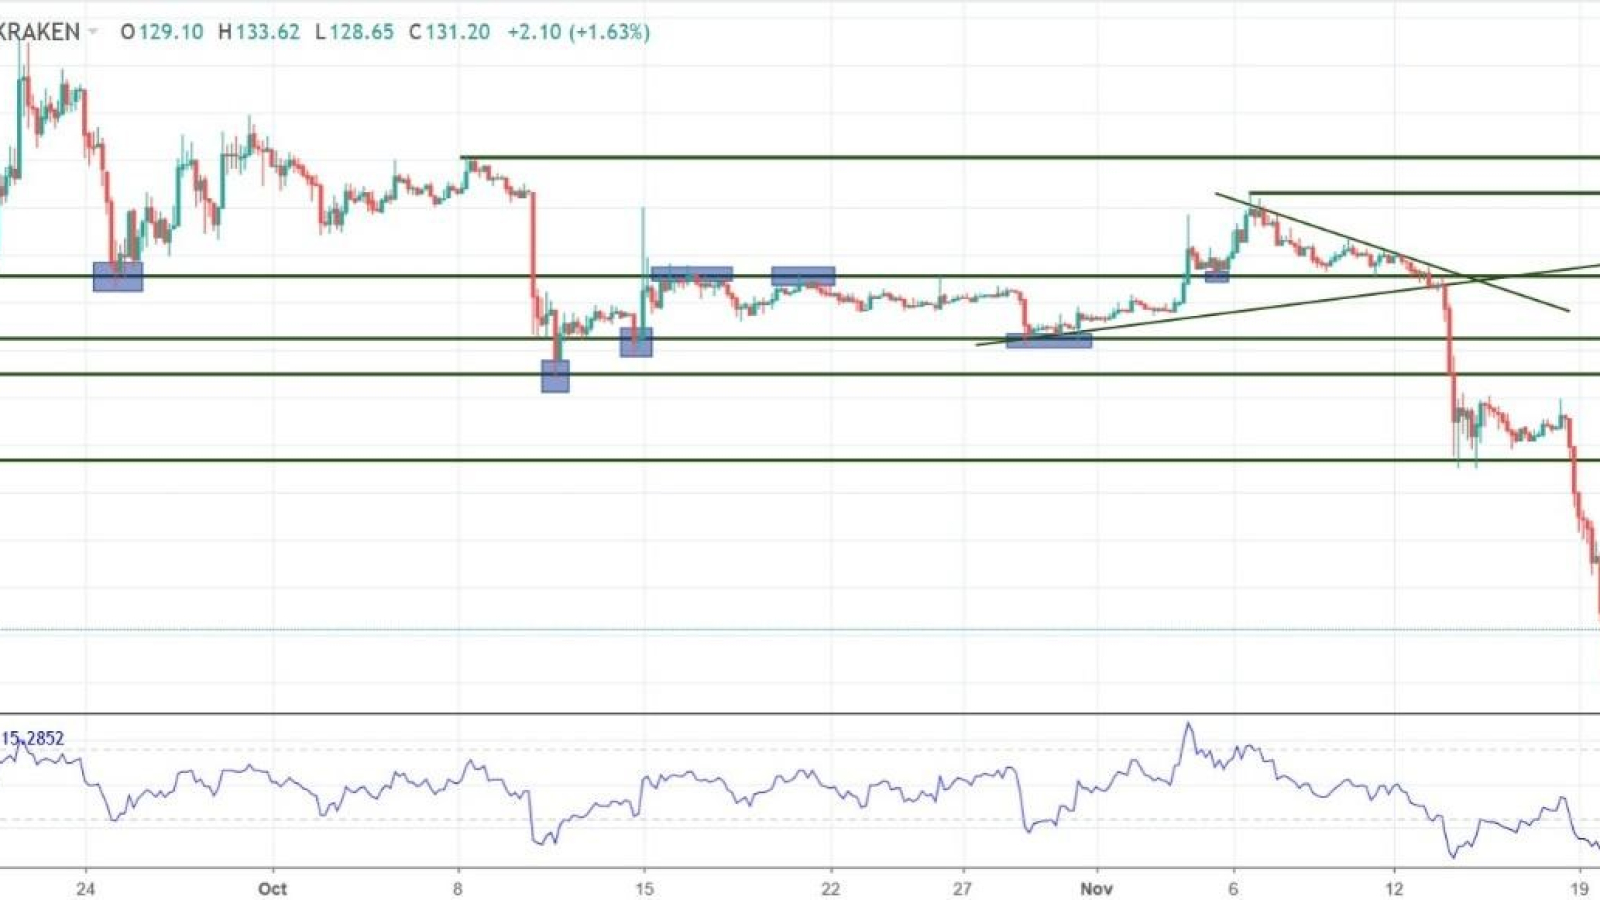
With a 36% drop over the last 7 days, ETH/USD is one of the worst performers among the top ten cryptocurrencies. The chart looks very similar to BTC/USD (big drop, followed by stagnation and another drop) and the bottom is nowhere in sight, so we can only speculate that $100 is the next major support.
The pair traded at $100 in May 2017, which is a relatively long time ago, so it’s fair to say the level is no longer a technical support but rather a psychological one (technical levels suffer “degradation” and lose importance if they are not touched in a long while). Currently, nothing supports a bullish view, other than the extreme oversold condition of the RSI.
Support zone: 120 (recent low) followed by 100 (psychological level)
Resistance zone: 150
Most likely scenario: drop through current support to reach 100
Alternate scenario: sideways, choppy movement at current levels, with small upside movement
Disclaimer: The opinions expressed by our writers are their own and do not represent the views of U.Today. The financial and market information provided on U.Today is intended for informational purposes only. U.Today is not liable for any financial losses incurred while trading cryptocurrencies. Conduct your own research by contacting financial experts before making any investment decisions. We believe that all content is accurate as of the date of publication, but certain offers mentioned may no longer be available.


 Dan Burgin
 Vladislav Sopov