Disclaimer: The opinions expressed by our writers are their own and do not represent the views of U.Today. The financial and market information provided on U.Today is intended for informational purposes only. U.Today is not liable for any financial losses incurred while trading cryptocurrencies. Conduct your own research by contacting financial experts before making any investment decisions. We believe that all content is accurate as of the date of publication, but certain offers mentioned may no longer be available.
XRP has recently seen a surprising increase in its price. It has gone over the important level of $0.6, which many traders think is a sign that its price might keep going up.
People who invest in XRP might even go higher than the 50-day Exponential Moving Average (EMA). If they do, it could mean that XRP is becoming more stable on the market.
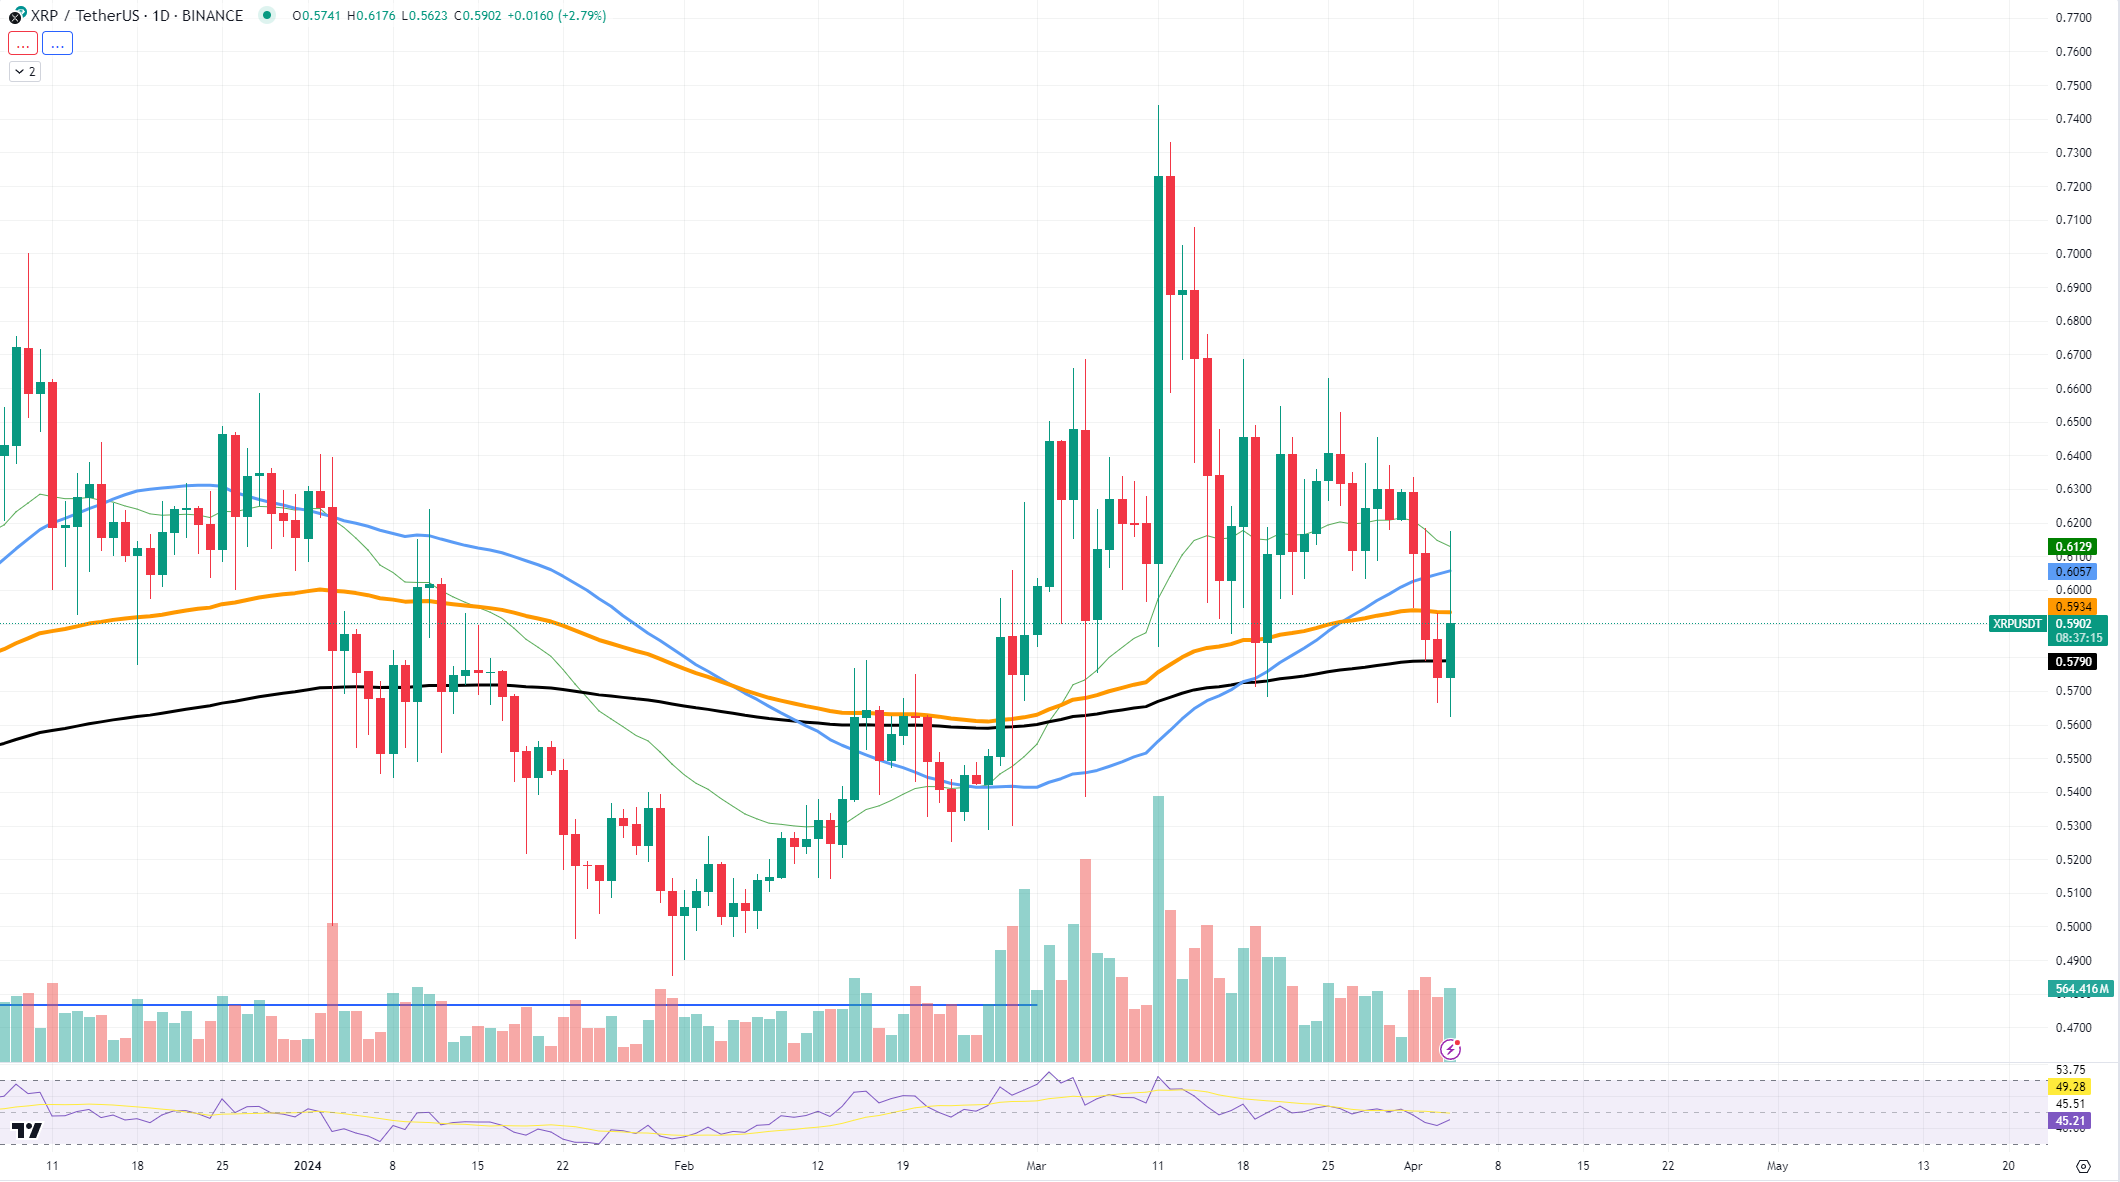
When we look at the XRP price chart, we see that it has been moving in a strong way. It was stable for a while, but then it went past the $0.6 mark quite unexpectedly. Previously, this level stopped the price from going higher. Now that it has passed this level, it looks like people are more interested in buying XRP.
If XRP stays above $0.6, we might see it try to go past the 50-day EMA. If it can end the day higher than this average, we could see the price go up even more, possibly reaching $0.65.

However, we must also think about what happens if the price starts to fall. The chart shows good support around $0.55, which has been a point of a previous price reversal. But if it falls below $0.55, the next big support is at $0.50. If the price reaches this lower level, we might see people start buying XRP again to stop the price from falling further.
Shiba Inu hits ceiling
Shiba Inu approaches the resistance posed by the 21-day Exponential Moving Average (EMA). If SHIB can surpass this resistance, it may signal the beginning of a rally, leading to a potential acceleration in price growth.
Looking closely at the SHIB chart, we notice that the price moves near $0.00002756, closely challenging the 21 EMA. This movement comes after SHIB's price experienced a considerable surge, followed by a period of consolidation. The key to future momentum will be whether SHIB can maintain its strength and break through the EMA line.

A definitive break above the 21 EMA could open the door to a further recovery, with the next resistance possibly around the $0.00003 mark. This area may act as a new challenge for SHIB, where it has previously encountered selling pressure.
Conversely, support levels are clearly established. The first level of significant support is found at approximately $0.00002256, a region where SHIB has found buyers in the past. If the price were to fall below this level, the next major support is around $0.00001941, which might serve as a stronger line of defense for the price to rebound.
Ethereum stays strong
Ethereum's resilience is often debated, especially during 2024's bullrun. A close examination of Ethereum's price chart suggests that the second-largest cryptocurrency is displaying a strong stance against prevailing market trends.
The current price of Ethereum stands at $3,378, with the asset showing signs of maintaining above significant support levels. The key support to watch is around the $3,011 mark, where the 100-day Exponential Moving Average (EMA) lies. It has previously acted as a strong support and may act like one again.
On the upside, Ethereum faces immediate resistance near the $3,500 zone, which coincides with the 50-day EMA. A consistent close above this average could signal a return of buying pressure, potentially leading to a test of higher resistances, possibly around the $3,600 to $3,700 range.
As for the positive scenario, if Ethereum can break through the $3,500 barrier, it may set the stage for a bullish run toward $3,600. This would be an indicator that Ethereum is not only recovering from sell-offs but also gaining momentum for a continued upward trajectory.
However, a slip below the 100-day EMA might push ETH near the $3,011 level, which could act as a secondary support. Falling below this could bring the next critical support into play around $2,625, corresponding with the 200-day EMA.
 Dan Burgin
 U.Today Editorial Team