Disclaimer: The opinions expressed by our writers are their own and do not represent the views of U.Today. The financial and market information provided on U.Today is intended for informational purposes only. U.Today is not liable for any financial losses incurred while trading cryptocurrencies. Conduct your own research by contacting financial experts before making any investment decisions. We believe that all content is accurate as of the date of publication, but certain offers mentioned may no longer be available.
While SHIB's chart reveals an unmistakable uptrend, the descending trading volume tells a story of its own. At first glance, reduced trading activity might raise alarms. However, for Shiba Inu, this dip in volume might actually be paving the way for bullish momentum.
Diving into the chart, SHIB's recent price movements clearly underscore an optimistic trend. This uptrend is marked by higher highs and higher lows, painting a promising picture for those invested in or tracking the coin. Yet, juxtaposing this uptrend with the declining trading volume, a paradox emerges. Typically, descending trading volumes in the face of a price increase could signal weakening momentum or an upcoming reversal. But the Shiba Inu narrative is playing out a little differently.
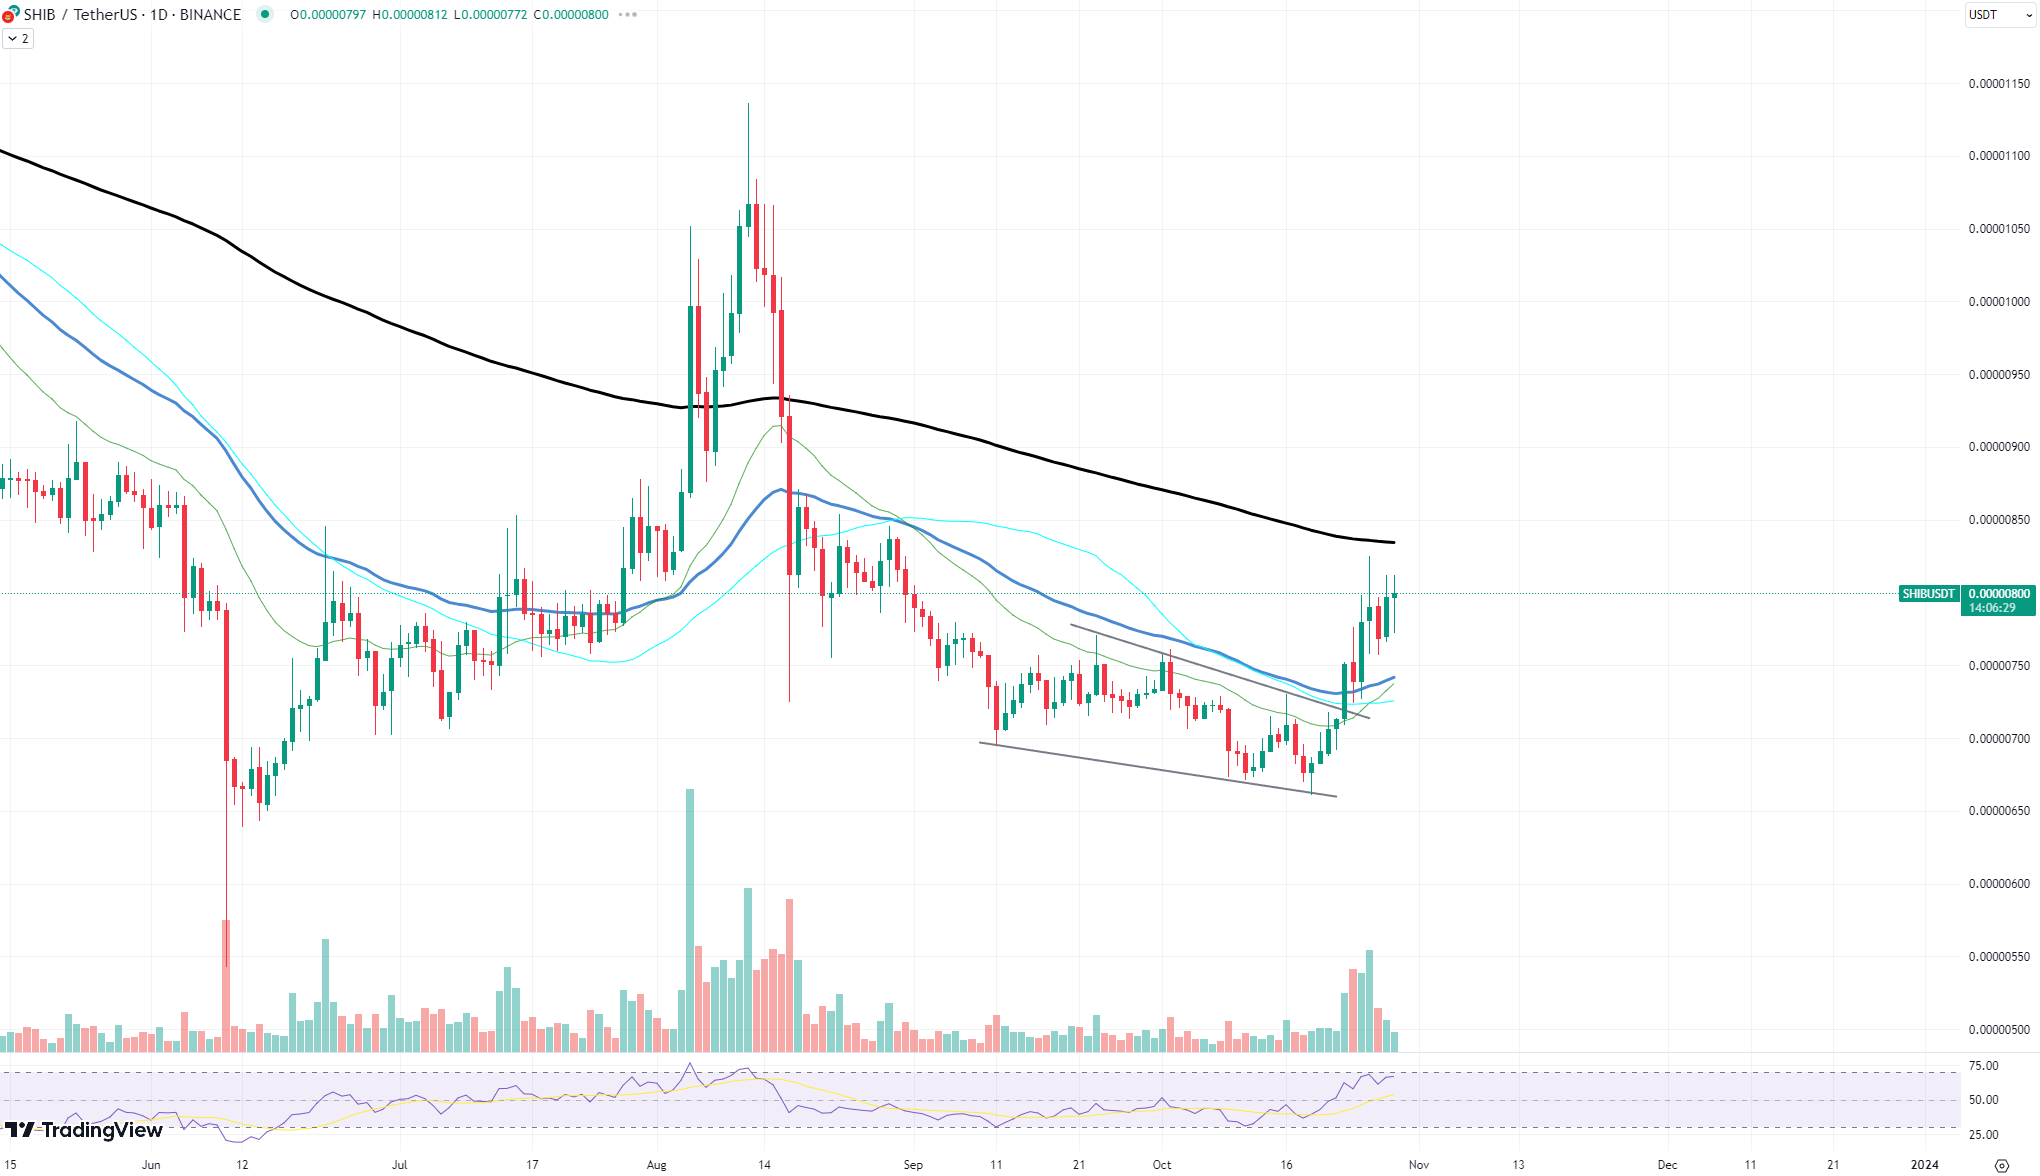
The reduced trading volume for SHIB can be interpreted in a unique light. Lower volume, in this context, can be indicative of decreased selling pressure. With fewer sellers flooding the market and offloading their holdings, SHIB finds itself in a peculiar position. If the majority of the orders in the market are buys, even with reduced overall volume, it means there is a net positive buying pressure. This can lead to a supply-demand dynamic that favors price appreciation.
Another noteworthy aspect is the resilience of SHIB's price. Even with diminished trading activity, the fact that SHIB's price has not plunged but instead showcases an uptrend shows the prevalence of bulls over bears at this point in time.
Ethereum aims for support
Ethereum, the foundational platform for countless decentralized applications and the second-largest cryptocurrency by market cap, has always commanded the attention of the crypto industry. Current data suggests Ethereum is in the midst of a correction phase, and the trajectory is pointing toward a crucial technical landmark: the 200 exponential moving average (EMA).
The 200 EMA serves as a vital tool for traders, offering insights into the asset's underlying trend. By giving more weight to recent price data, the 200 EMA paints a clearer picture of price momentum and potential market direction. Historically, this moving average has often functioned as a robust support or resistance level. In Ethereum's case, the 200 EMA is shaping up to be a significant support point.

A closer look at the chart reveals several noteworthy observations. First, there was a noticeable spark in trading volume in the past few months. Such spikes often signify strong buying or selling sentiment and can precede significant price movements. However, as the chart shows, the recent trading volumes for Ethereum have been on a decline. Descending trading volume post a sharp uptick can be indicative of a potential slowdown in buying pressure, leading to price corrections, and that is precisely the phase Ethereum seems to be navigating currently.
In terms of price analysis based on the current chart, Ethereum appears to be testing the waters around the 200 EMA, finding its footing after a period of heightened volatility. If the 200 EMA holds firm, Ethereum could find the necessary support to prevent further decline and potentially pave the way for a rebound.
ADA hits roadblock
For Cardano (ADA), the 200 exponential moving average (EMA) resistance level has become a contentious point. On the surface, it appears ADA struggles to break past this daunting resistance. But when diving deeper into the technicals, another narrative comes to light — ADA's oversold position, particularly reflected in its relative strength index (RSI).
By looking at the chart, it becomes evident that Cardano has made multiple attempts to surpass the 200 EMA. Each attempt has met with resistance, pushing the price back down, forming what seems like an impenetrable ceiling. This repetitive pattern might lead some to assume that the 200 EMA is the primary obstacle. However, the real story lies in ADA's RSI.
Cardano's RSI is navigating the upper echelons, indicating a clear overbought status. This overbought scenario represents a challenge as significant as, if not more than, the 200 EMA resistance.
 Dan Burgin
 U.Today Editorial Team