
Disclaimer: The opinions expressed by our writers are their own and do not represent the views of U.Today. The financial and market information provided on U.Today is intended for informational purposes only. U.Today is not liable for any financial losses incurred while trading cryptocurrencies. Conduct your own research by contacting financial experts before making any investment decisions. We believe that all content is accurate as of the date of publication, but certain offers mentioned may no longer be available.
Shiba Inu, the popular meme-based cryptocurrency, is currently facing three crucial price levels that investors should not overlook. As the market moves forward, these levels may hold the key to understanding Shiba Inu's future price trajectory and possible growth potential.
First, the trendline resistance has been continuously pushing Shiba Inu's price down since March 15. This resistance level is a critical barrier for the cryptocurrency, and overcoming it could potentially lead to a bullish breakout. Investors should closely monitor the price movement around this level to identify possible entry and exit points.
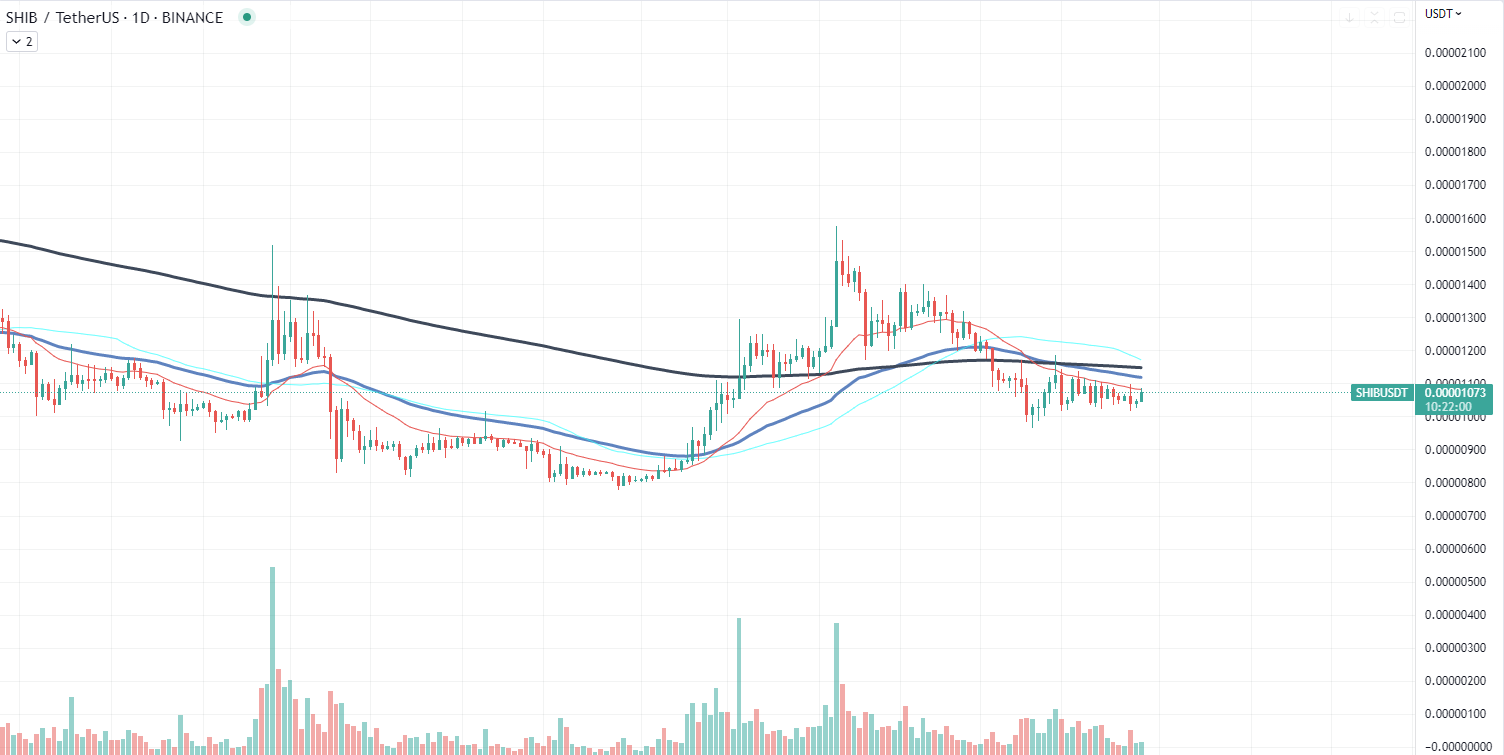
Second, the 50-day exponential moving average (EMA) is another vital level to watch. Currently located above the price, this EMA serves as an essential indicator of the asset's short-term momentum. A break above the 50-day EMA could signal a shift in sentiment and increased buying pressure, resulting in an upward price movement.
Lastly, the 200-day moving average (MA) is a crucial long-term indicator situated at $0.00001. This level acts as both support and resistance, depending on the asset's price in relation to the MA. If Shiba Inu can successfully break through the trendline resistance, it might experience a price swing that propels it directly toward the 200-day MA.
XRP facing golden cross
XRP has recently experienced a significant 45% price surge, positioning it for a potential golden cross event. The golden cross, a rare technical indicator in the world of trading, arises when a short-term moving average surpasses a long-term moving average, typically the 50-day and 200-day moving averages, respectively.
The impressive price performance of XRP, currently trading at $0.54, can be partially attributed to the optimism surrounding Ripple's ongoing legal battle with the U.S. Securities and Exchange Commission (SEC).

Over the past month, the token has added roughly 40% to its value, as investors anticipate a favorable outcome for Ripple in 2023. The recent price action has also been accompanied by a six-month high in trading volume, further underscoring the growing interest in the digital asset.
Should the crossover event materialize, it could generate increased enthusiasm among investors, potentially leading to a self-reinforcing cycle of rising prices and heightened demand. This, in turn, could provide the necessary fuel for XRP to maintain its bullish momentum and achieve new highs in the foreseeable future.
MATIC gains some traction
Polygon (MATIC), a popular Layer 2 scaling solution for Ethereum, has recently witnessed a notable technical development. The cryptocurrency managed to reach its 200-day exponential moving average (EMA) and successfully bounce off this critical threshold.
This bounce has propelled the digital asset to reach the 50-day moving average, suggesting the possibility of a breakthrough that could place MATIC back on a solid uptrend trajectory.
The 200-day EMA serves as a significant indicator for many investors, as it can help determine the overall market trend for a particular asset. In the case of MATIC, bouncing off this level demonstrates resilience and a possible shift in momentum. By reaching the 50-day moving average, MATIC has set the stage for a potential bullish crossover, where the shorter-term average surpasses the longer-term average. This event is often considered a positive signal, indicating that the asset may be entering a new phase of growth.
If Polygon's MATIC manages to break through the 50-day moving average and establish a solid uptrend, it could attract increased attention from traders and investors alike. A sustained uptrend might lead to higher trading volumes and a more robust market for the digital asset.
 Dan Burgin
 U.Today Editorial Team