
After a minor recession, LINK has suddenly jumped by 17% in a day, which surprised many traders. Some of them were wise enough to invest in LINK and buy at $2. If you haven’t done it but want to join the game, it’s not all lost: you can still make a short-term profit. Let’s see how to do it: read Chainlink price forecasts from TradingView users.
Great times for ALTS and LINK/BTC
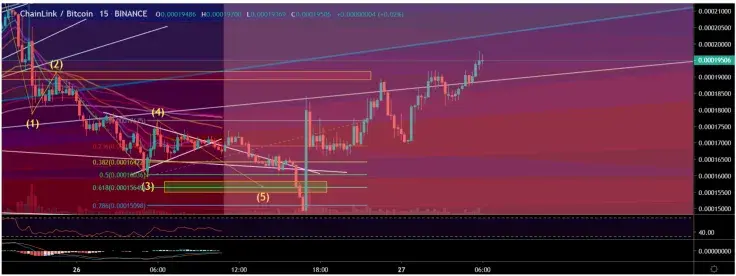
The descending triangle has been broken with a very positive outcome. Traders had a shorting opportunity with his ending 5th wave diagonal. Our target is a strong support and 0.618 fib level. We have a pretty ideal setup here.
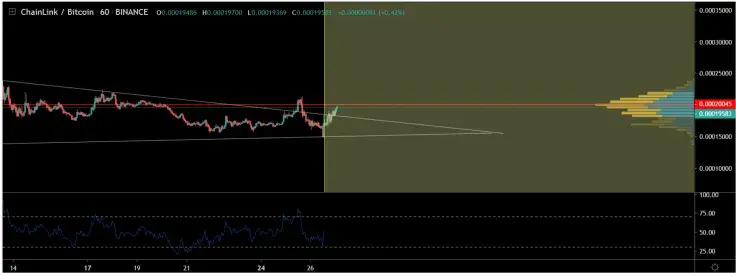
When to buy LINK? You can do it right now, because it’s not likely to fall dramatically in the nearest time. Link has just hit a long term trend line: zoom out and judge for yourself . The currency is set for a nice profit in the mid-term.
But what if LINK drops again? It’s unlikely that we will break below the 15500 region, but if we do, then it is possible to see some sort of further consolidation within a triangle pattern made up of those two blue trend lines.
Here’s one great recommendation from trader Etch1234: “Always put your stop a little further than you think, and your target a little closer than you said.”

Don’t miss the next targets
Want to short? Here’s a risky (though not so much) TCCS strategy for LINK/BTC
Buy LINK somewhere between 0.00019 to 0.00018, if you get lucky to do so.
Since Target 1: 0.000196 has been reached, opt for:
Target 2: 0.00021
Target 3: 0.00023
By the way, LINK can even test the area of 0.00024615 BTC to bring you 20-30% profit. If you’re patient enough, you can witness such level in the following days.
24K is the next critical target
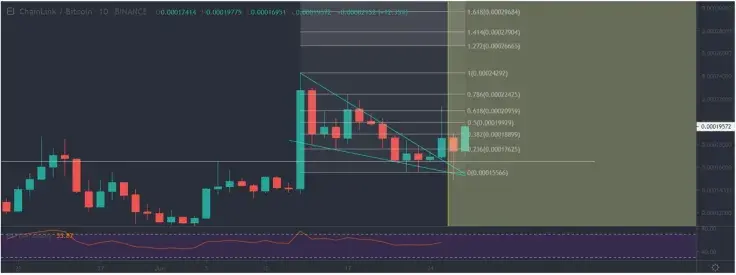
Here’s the proof of the above-mentioned strategy. According to user ArfixArdian, breaking the falling wedge pattern and potentially testing 24k sat again, a break from 24k would make this coin jump to 26k.
By the way, some traders even predict that LINK will move in the upward channel to reach 34k satoshi, so keeping coins for a while definitely makes sense. However, since LINK is pretty unpredictable, always watch daily close if you plan to hold this asset.

A few words on technical indicators
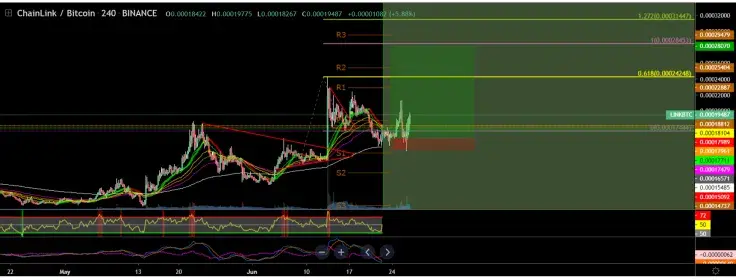
Still doubt whether trading LINK makes sense? After analyzing a 4hr chart, user Blockchain_Bob gives us a few reasons for trade:
-
Bullish RSI divergence
-
Upticking histogram
-
Potential MACD bull cross
-
4hr support established
-
Bounce from 20ma on Daily
-
Increasing volume
Isn’t that enough to prove that Chainlink is worth traders’ attention?
Final thoughts
So far, LINK is finding support above the close of the former range high, and we’re witnessing a slight bullish div on the 4H. What to choose? LINK/BTC or LINK/USD? The first pair seems to be simply more popular; though rising by 50 cents in a day also makes sense for such coin as LINK. Interestingly, some traders claim that if $/BTC pair goes on a rip upwards, we should expect a pullback to 13K sat: the current situation is a bit different though. Seems like alts are on the rise!
Chainlink (LINK) price charts by TradingView
 Dan Burgin
 U.Today Editorial Team