Bitcoin is under the spotlight of the crypto community: it’s slowly growing, but will it hit the $6,000 threshold? Traders are divided into two camps: ‘moon boys’ with positive and somewhat unrealistic BTC price predictions, and those who claim that Bitcoin should dump soon. What do TradingView experts think about it? Their assumptions are based on technical indicators, and here’s what we have.
The potential for the big drop is coming

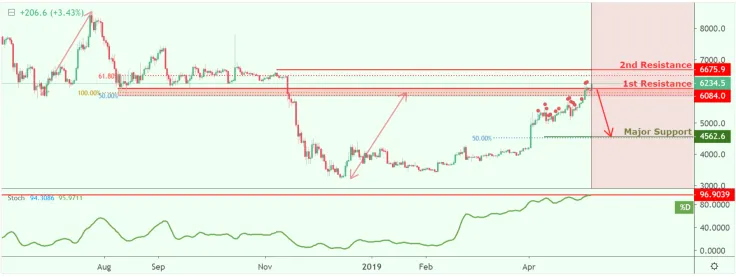
BTC/USD is testing the first resistance at $6,084.0 (horizontal pullback resistance, 100% Fibonacci extension, 50% Fibonacci retracement ) where a strong drop might occur to the major support at $4,562.6 (50% Fibonacci retracement ). Stochastic is on resistance as well, so it’s possible that BTC will fail to break it, and fall. Trading CFDs on margin carries high risk.
Bitcoin is wounded

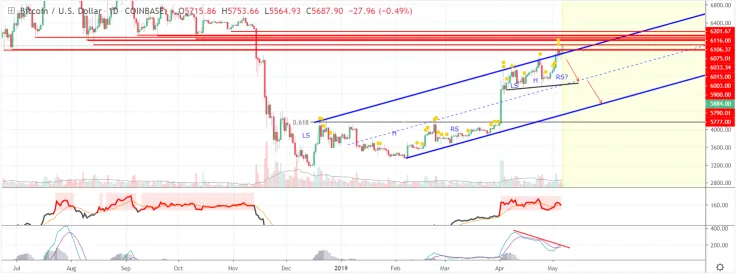
Looking at the daily chart, we can see that Bitcoin has rallied into the top of the uptrend channel AGAIN. However, this time it contacted with the bottom of the major overhead resistance zone, which is at $5,777 on the Coinbase chart. BTC’s price actually extended above the uptrend channel (in blue) tested the bottom of the major overhead resistance zone (red) and then retreated back into the uptrend channel. What does it mean?
- The breakout above the uptrend channel failed.
- BTC was rejected on its initial test of the exact bottom of the major overhead $6,000 resistance zone, failing to maintain a price above $5,777 on the Coinbase chart.
- This price movement concurs with the exhaustion seen in numerous indicators.
The BTC price is currently testing support on the recent high from the 24th. If that level is held, we will likely make another run up toward the top of the channel. If not, then I would expect a potentially sharp selloff that could complete a right shoulder of this asymmetrical (potential) head and shoulders pattern. That would trigger a massive drop.
What’s the long-term perspective for BTC?

As VaidoVeek notes, things have calmed down a little bit after that pump to the major mid-term target area of ~$5,800, and now it is the correct time to look at the charts.
I mentioned this midterm key area almost after the pump from the $4,000 to the $5,000 and now, after multiple attempts, the "clean" area is filled, the price has reached into the previous support levels which now became resistances. This area was a major support level on the last year, multiple rejections around the $6,000 levels. Let's dig a little bit deeper into this level, the gray area.
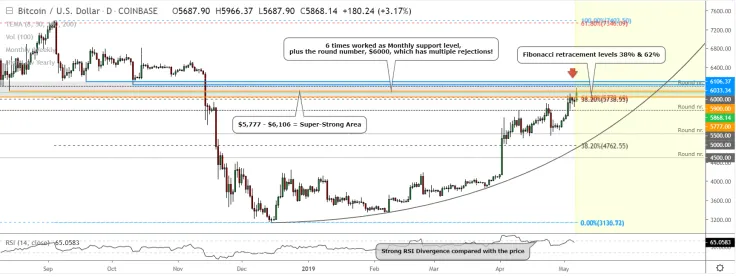
The Gray Area in between $5,777 - $6,106 consists of multiple strong levels. There are two major price levels and if we count also that mentioned round number $6,000 then we get three.
The area between the orange lines ($5,777-$5,900) is working currently as a resistance and as a first bigger obstacle to making another move upwards.
There are also two major Fibonacci retracement levels:
- 38% retracement level: pulled from the 2018 May high to the 2018 low point.
- 62% golden ratio: pulled from the 2018 September high to the 2018 low point.
So, the first obstacle is already really strong but that's not all!
The round number just after that orange area is $6,000. It becomes a resistance on our watch list. So, the second important criteria in this gray area but that's not all either! There is also the area which is between blue lines ($6,033 - $6,106).
Thus, the gray area consists of 6 Monthly Lows from the last year, 2018. 6 times it has worked as a major monthly support level, and if we add here also this significant round number, plus some perfect Fibonacci retracement levels, then this area is a game changer.
A break above the gray area will be a really positive sign for a long-term view. Yes, the $6,500 is also a strong area, but after the breakout above the $6,106 should trigger some powerful bullish price action.
Final thoughts
The upwards obstacle is really strong and meanwhile, the price almost needs a slight correction downwards to prepare for it to make another push through the gray area. If the correction starts then obviously, you can enter into the market and I can give some mid-term or short-term strong bounce areas but as for the long-term perspective, the gray area ($5,777 - $6,106) is the key!!
Price charts are taken from TradingView

 Arman Shirinyan
 Alex Dovbnya
 Dan Burgin
 Denys Serhiichuk