
The recently predicted Bitcoin price retracement has inspired traders to go short. Now that the cryptocurrency costs around $5,200, Internet users are planning to buy some BTC again, but is it the right time? What if BTC continues falling in value? Let’s read Bitcoin price predictions from TradingView users to find this out.
Don’t miss the short opportunity!
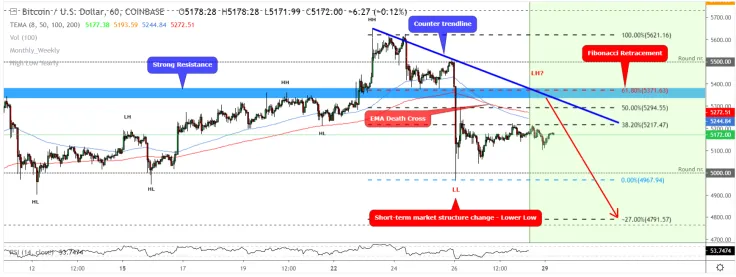
Judging by technicals, there could be a possible BTC short opportunity! This evidence wasn’t easy to discover because of BTC’s sideways movement between $5,000 - $5,500.
Here’s what VaidoVeek has seen in the area of $5,335 - $5,400:
- The Fibonacci Golden ratio is now 62%.
- Strong Bitcoin price area (below the $5,400) should act as a resistance.
- The short-term, counter trendline should act like a resistance, too. At first glance, it doesn’t seem so significant, but if this matches exactly with the mentioned area around $5,400, then it will be one of the important criteria.
- EMA Death Cross on the 1H chart.
- Market structure presents new lower lows and possibly new lower highs.
Besides, if this is possible, wait for a bearish candlestick formation on the 4H timeframe. 4H time frame candlestick patterns are the most reliable ones.
Thus, the present technical indicators show that this level may work as a strong Bitcoin price level for short term price reversal, and there are a little bit of hidden indications that this level may hold!
Pullback to $4,200 is unlikely to happen
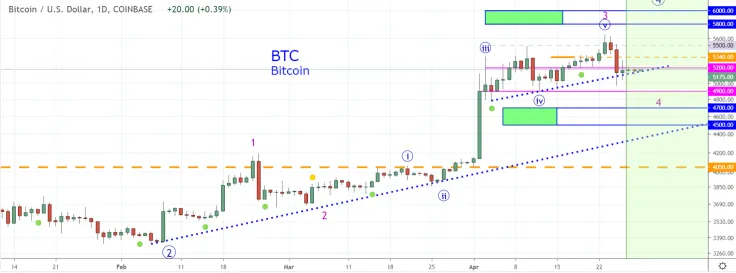
According to goldbug1, the pullback to the low $4k is impossible, and he would stake on anything between $4,700 - $5,000. The price is supportive so far. We could see a long setup sooner than later. We are monitoring the price action for a swing trade long, and if it does happen, we will issue a trade signal. These opportunities are pretty rare, so we should monitor the market and try to take all possible advantages, especially when it looks its worst.
There is still the potential for some downside, so one should harness the willpower and courage to trade. If you can’t do that, “then just step aside and let the market determine the outcome, stop guessing. But if you do, that short squeeze could put a contrarian long, well into the money. Let the market stabilize.”
The $325 gap in BTC value looks dangerous
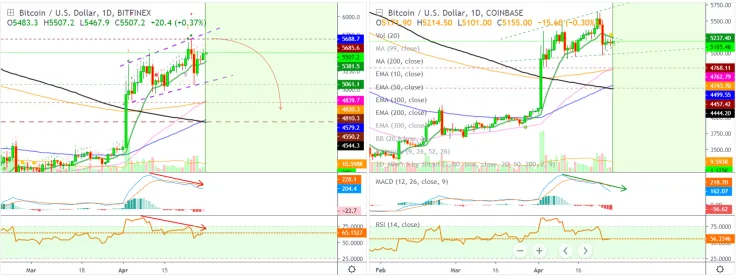
If we compare Bitcoin (BTC/USD) prices on Coinbase vs BitFinex, the price difference is becoming bigger, which means the risk is starting to increase. At the moment, the price difference is $325, and we see BitFinex moving higher and higher but with no volume, which is a terrible signal, bloody Monday coming soon?
Looking at the MACD on both exchanges, the bearish is becoming more pronounced. While there has been no action on Coinbase, BitStamp, BitMEX, etc., BitFinex continues to grow – that’s very suspicious. One possible explanation is that this is just the usual Tether (USDT) situation.
If BTC/USD continues falling, you can expect support to be found first in the $4,900 - $5,000 range, followed by EMA50 if the above level breaks.
According to alanmasters, the break to the upside is very unlikely, judging by the Coinbase chart. EMA10 is still the challenge to break, and the structure of the chart isn't that inviting for an impulse to the upside.


 Arman Shirinyan
 Alex Dovbnya
 Dan Burgin
 Denys Serhiichuk