
Disclaimer: The opinions expressed by our writers are their own and do not represent the views of U.Today. The financial and market information provided on U.Today is intended for informational purposes only. U.Today is not liable for any financial losses incurred while trading cryptocurrencies. Conduct your own research by contacting financial experts before making any investment decisions. We believe that all content is accurate as of the date of publication, but certain offers mentioned may no longer be available.
The cryptocurrency market is trying to recover. And if assets such as Bitcoin and Ethereum demonstrate a readiness to continue the rise, then Litecoin and EOS will reach for the next test of immediate support. Only after that, growth signals may appear and one can expect another attempt at a qualitative rise in asset value.
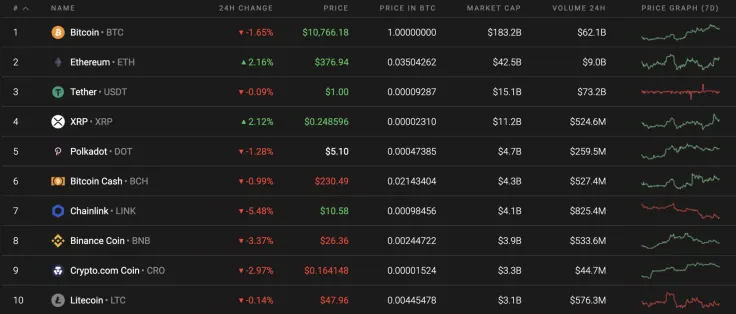
The crucial data for Bitcoin (BTC), Ethereum (ETH) and XRP today:
|
Name |
Ticker Advertisement
|
Market Cap |
Price |
Volume (24h) Advertisement
|
Change (24h) |
|
Bitcoin |
BTC |
$199,496,434,491 | $10,788.19 | $34,015,899, 441 | -1.26% |
|
Ethereum |
ETH |
$42,545,910,201 | $377.72 | $20,965,078, 505 | 2.58% |
|
XRP |
XRP |
$11,211,486,484 | $0.248910 | $2,376,939 800 | 1.98% |
BTC/USD
On the four-hour chart, the price has left the downtrend channel; however, the RSI indicator is testing the resistance line. For this reason, one should not exclude yet another attempt to decline to the level of $10,540 with subsequent upward movement.

A strong signal in favor of a continuation of the bullish impulse will be a breakdown of the upper border of the large descending channel with the price fixing above the $12,005 level.
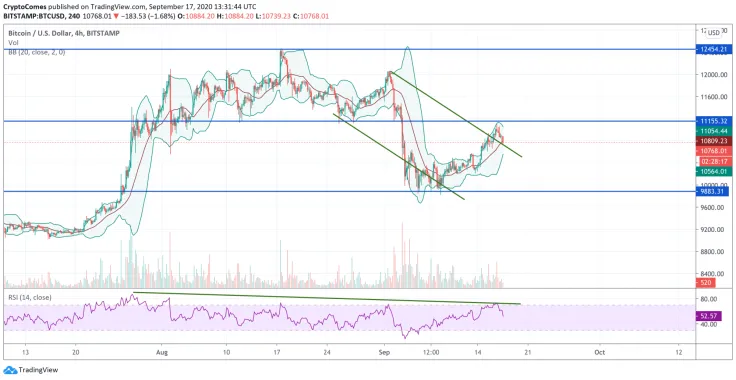
Its cancellation would be a breakdown of the level of $9,505, which will indicate a break in the lower border of the descending channel and may provoke an accelerated fall in the value of the asset. As a rule, the breakdown of the downward channel is a very reliable signal for further development of bearish momentum.
Bitcoin is trading at $10,768 at press time.
ETH/USD
ETH/USD quotes on the daily chart were able to push off from the lower border of the Bollinger Bands indicator, but the breakdown of the middle line has not yet taken place. Such a signal would indicate a full-fledged resumption of the upward trend.
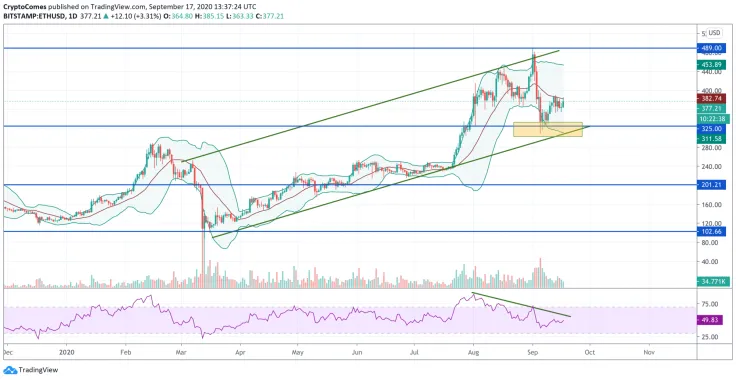
Potential remains for the completion of the formation of the "5-0" upward pattern—only the test of the lower border of the upward channel is missing. A strong signal in favor of continuing the rise would be the breakdown of the trend line on the RSI indicator. A positive step would be the breakdown of the support area with the price fixing below the $250 level, which would indicate the cancellation of the "5-0" pattern and the continuation of the fall to the $150 level.
Ethereum is trading at $378.64 at press time.
XRP/USD
Yesterday, during the day, the XRP price consolidated for a long time at the two-hour EMA55 level and, late at night, buyers managed to form a powerful bullish impulse that broke through the $0.250 resistance and set a two-week high at $0.258.
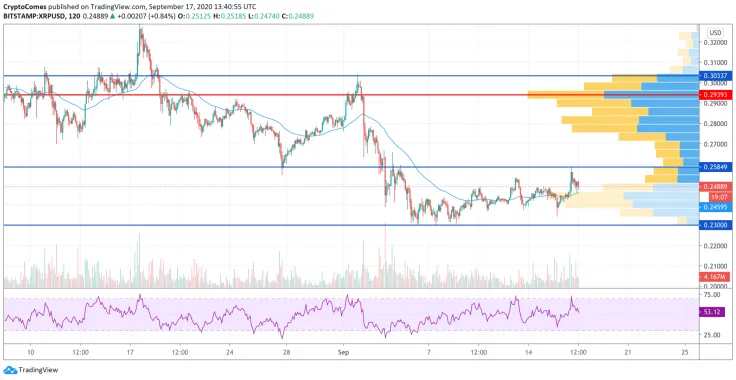
However, the XRP price could not stay in the high zone and rolled back to the $0.250 level in the morning. If today this level keeps the pair from further decline, then growth will continue to a new weekly high in the area of $0.270.
XRP is trading at $0.2488 at press time.
 Dan Burgin
 U.Today Editorial Team