
Disclaimer: The opinions expressed by our writers are their own and do not represent the views of U.Today. The financial and market information provided on U.Today is intended for informational purposes only. U.Today is not liable for any financial losses incurred while trading cryptocurrencies. Conduct your own research by contacting financial experts before making any investment decisions. We believe that all content is accurate as of the date of publication, but certain offers mentioned may no longer be available.
The bullish mood has turned bearish as almost all of the Top 10 coins are red. Bitcoin (BTC) is trying to remain in the green zone, rising by 0.05% over the last day.
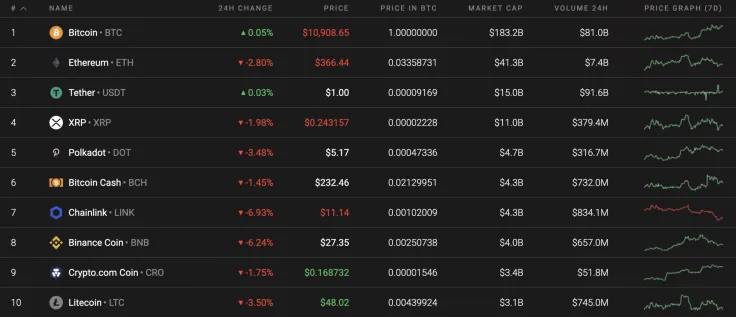
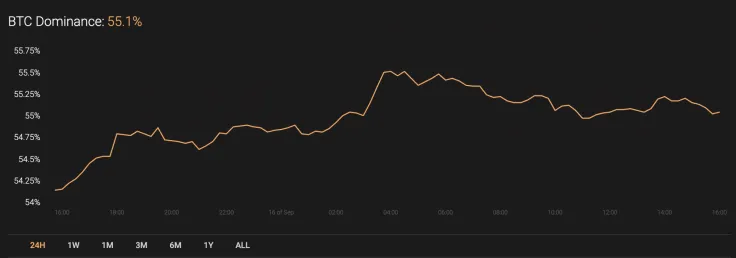
The decline of most of the altcoins has positively affected the market share of Bitcoin (BTC), which has increased by 1% and now accounts for 55.1%.
The relevant Bitcoin data for today:
-
Name: Bitcoin
Advertisement -
Ticker: BTC
-
Market Cap: $201,927,701,737
-
Price: $10,920.28
Advertisement -
Volume (24h): $34,371,398,129
-
Change (24h): 0.16%
The data is relevant at press time.
BTC/USD: Can traders expect a false breakout of the $11,000 mark?
Yesterday, buyers managed to pierce the daily EMA55 and set a weekly high around $10,940. However, sellers paused the recovery in the Bitcoin (BTC) price and did not allow the pair to gain a foothold above the level of $10,800.
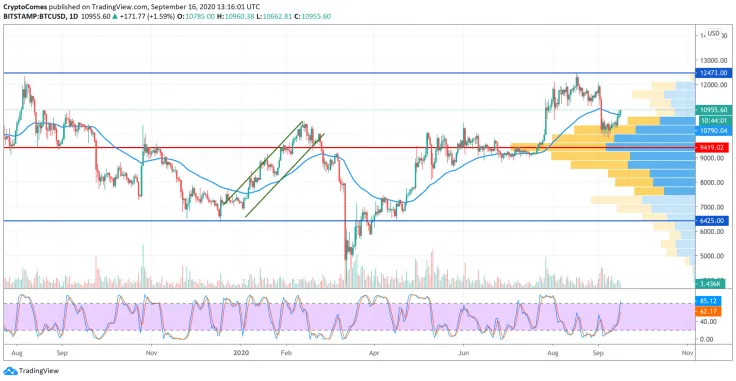
Today, the rollback from the daily moving average EMA55 is not over yet. During the day, the pair may decline to the support of $10,500. If this level stops sellers, the attempt to break through the daily average price level will be repeated and the maximum is expected in the resistance area of $11,200.
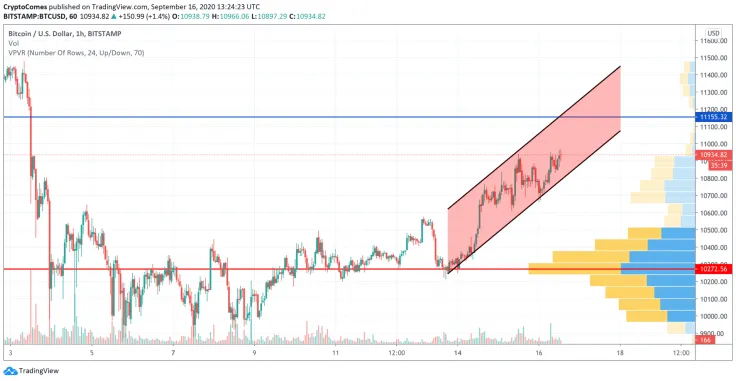
On the hourly chart, Bitcoin (BTC) keeps trading within the rising channel formed a few days ago. The trading volume remains high, however, liquidity is decreasing, which means that a reversal will start soon.

The endpoint of the growth might be the "mirror" level at $11,150, where bears may seize the initiative.
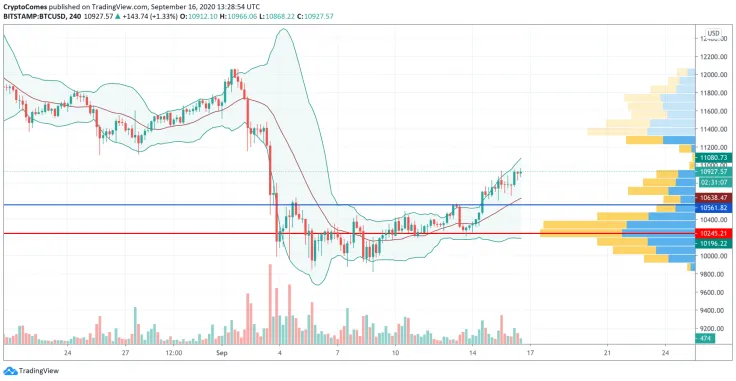
However, on the 4H time frame, the picture is bearish. The rise of Bitcoin (BTC) from $10,500 has not been supported by a rising trading volume, which means bulls are unlikely to update local peaks. Applying the Bollinger Bands indicator on the chart, a decline from around $11,000 may end at $10,500, where most of the liquidity is focused. Such price action is relevant through the end of the week.
Bitcoin is trading at $10,942 at press time.
 Dan Burgin
 U.Today Editorial Team