
It looks like Bitcoin decided to update the maximums of June when it almost reached $14,000. Besides the price, the leading cryptocurrency is also setting another record. The hashrate of the Bitcoin network has updated the historical maximum at 74,548 EH/s.
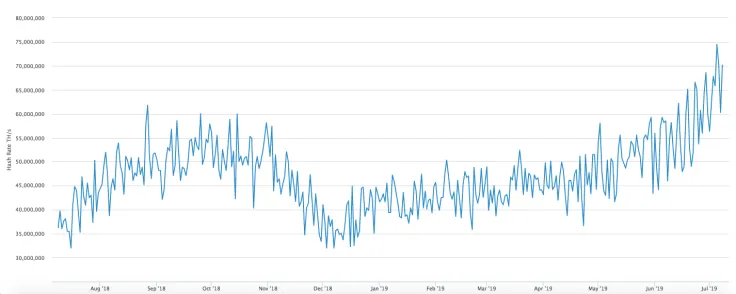
At the same time, the index of the complexity of Bitcoin mining is also at the maximum. While the size of the average transaction commission in the network of the first cryptocurrency dropped below $2, at the beginning of the month it was at the mark of $4.
In terms of the technical analysis, the picture is looking the following way.
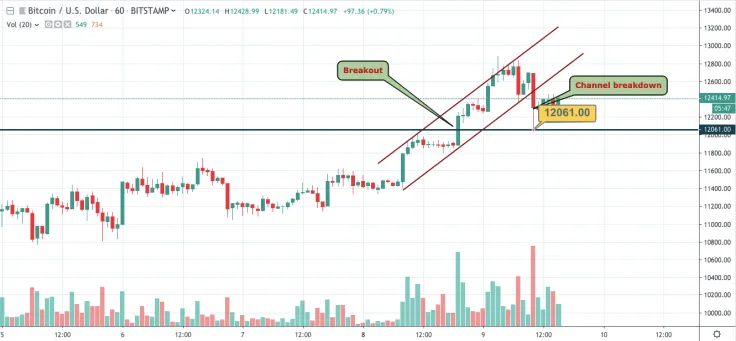
Bitcoin followed our previous prediction, and the mark of $12,000 was easily surpassed.
During the day the leading crypto jumped out of the ascending channel, setting a bearish lower maximum at $12,700. The price, however, soon rebounded from the previous support, which was at the level of $12,061, keeping the bulls in the game. A break above $12,700 will further strengthen the bullish position and allow the rally to levels above $13,000 according to the chart.

On the other hand, a sudden drop in prices below $12,061 can drastically change sentiment.
However, Artur Dzhalilov, CEO at Vexel is more optimistic about the future price of BTC:
New impact will come in September-October when Bitcoin will reach $20,000 and in December we'll see the new price level between $35,000-$40,000 per Bitcoin.”
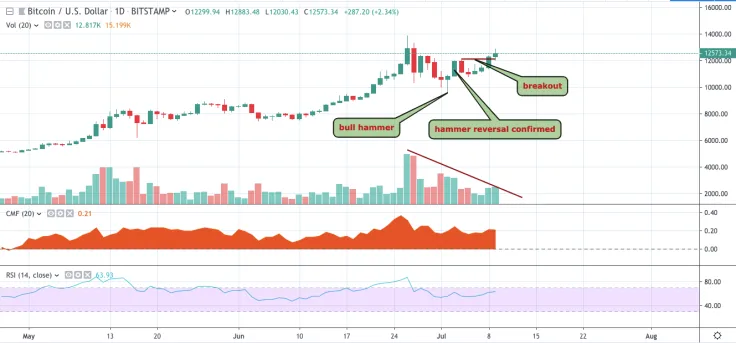
On the daily time frame, one can see how the price rise above $12,061 broke the bearish pattern from falling highs. It is also important that the breakthrough of key resistance was accompanied by an increase in trading volumes.
The Relative Strength Index (RSI) is at 50, indicating bullish sentiment, while Chaikin Money Flow also signals a growing demand. Thus, within the next 24 hours, BTC can easily overcome the $13,000 milestone, aiming at the $13,880 mark corresponding to the maximum on June 26.
The price of BTC is trading at $11,379 at the time of writing.
 Dan Burgin
 U.Today Editorial Team