
Disclaimer: The opinions expressed by our writers are their own and do not represent the views of U.Today. The financial and market information provided on U.Today is intended for informational purposes only. U.Today is not liable for any financial losses incurred while trading cryptocurrencies. Conduct your own research by contacting financial experts before making any investment decisions. We believe that all content is accurate as of the date of publication, but certain offers mentioned may no longer be available.
In the last few weeks, Bitcoin and the cryptocurrency market in general have not shown the greatest financial results after going through a 30% recovery that was expected by numerous experts in the industry.
Bitcoin reaches a 50-week moving average
According to the most recently provided TradingView data, Bitcoin is currently inching closer to the traditionally strong technical support of the exponential 50-week moving average, which usually acts as a reversal point for assets moving in the uptrend.
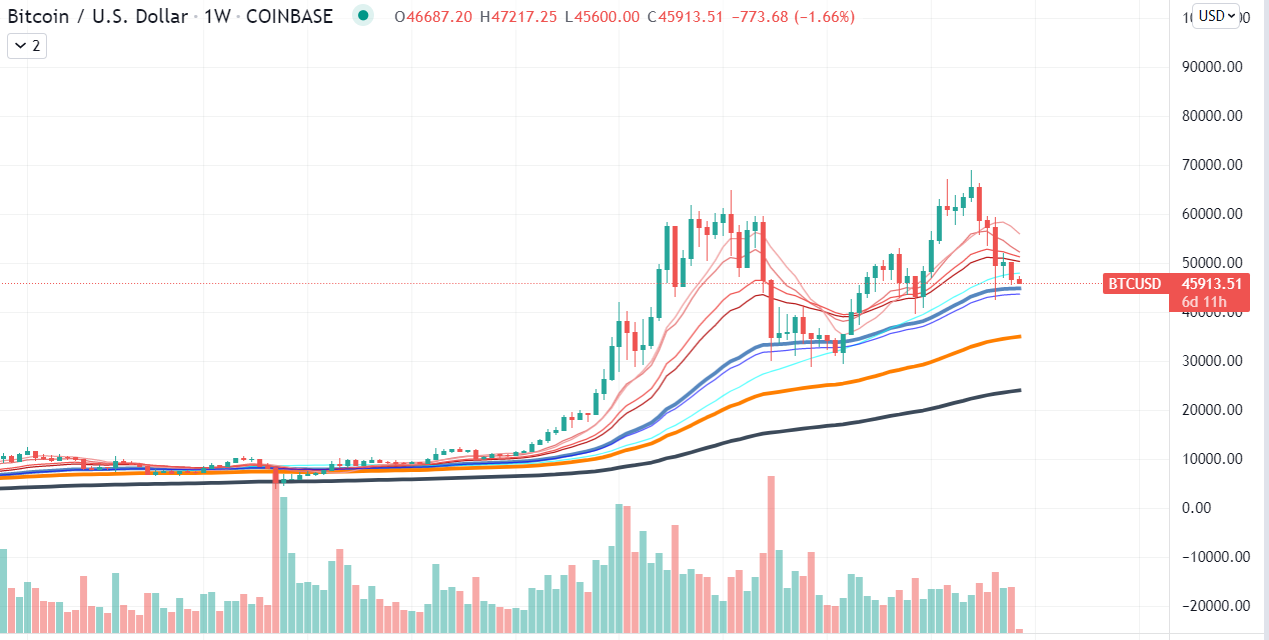
Bitcoin is not unfamiliar with the mentioned support indicator and was already in the same zone back in September. But it has "successfully failed" to reach the line itself and recover back earlier than was previously expected.

The last direct test of the indicator happened in July when the first cryptocurrency lost more than 45% of its previously gained value. After a short consolidation around the indicator, the asset has started recovering as fast as it retraced down and has reached $51,000 in less than two months.
What happens if the support fails?
Usually, whenever such strong support as the moving average around 50 fails, assets tend to keep their current trend and continue to move in the direction they were moving in before reaching the technical support.
The same thing happened back in May 2018 when BTC dropped below $6,500, which was the exact value in which the 50-week moving average was moving. After that, the first cryptocurrency dropped even further, reaching its lowest point since September.
 Dan Burgin
 U.Today Editorial Team