Disclaimer: The opinions expressed by our writers are their own and do not represent the views of U.Today. The financial and market information provided on U.Today is intended for informational purposes only. U.Today is not liable for any financial losses incurred while trading cryptocurrencies. Conduct your own research by contacting financial experts before making any investment decisions. We believe that all content is accurate as of the date of publication, but certain offers mentioned may no longer be available.
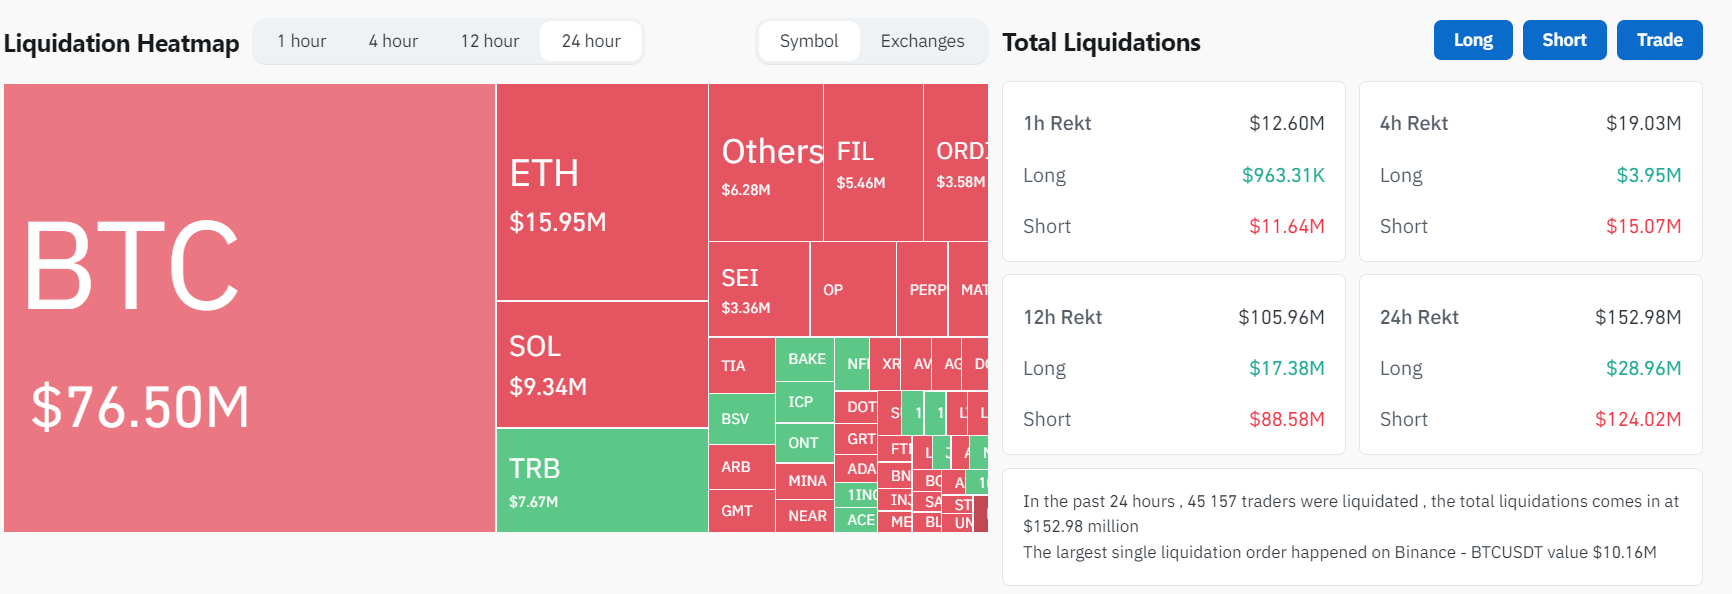
The cryptocurrency market has witnessed a crucial surge in the Bitcoin (BTC) price, hitting a $45,000 high that resulted in a significant volume of liquidations. In a startling move that caught many off guard, the market saw liquidations amounting to $145 million. A majority of these were short positions, where traders had placed bets on a market reversal at the start of 2024, only to be swept away by unexpected bullish momentum.
This sudden and robust price action on Bitcoin is a clear indication of the continuation of the bull run, signaling a potent start to the year. A breakthrough above the $45,000 mark not only indicates good things for market sentiment but also fortifies the belief that the bullish market is continuing. The next major event on the horizon is the anticipated approval of a spot Bitcoin ETF in the second week of January.

Investors, while optimistic, should brace for volatility as the market might experience a "sell the news" event post-ETF approval. Such events typically occur when the price of an asset rises in anticipation of a positive event and then falls after the event occurs as traders take profits.
Bitcoin's price performance
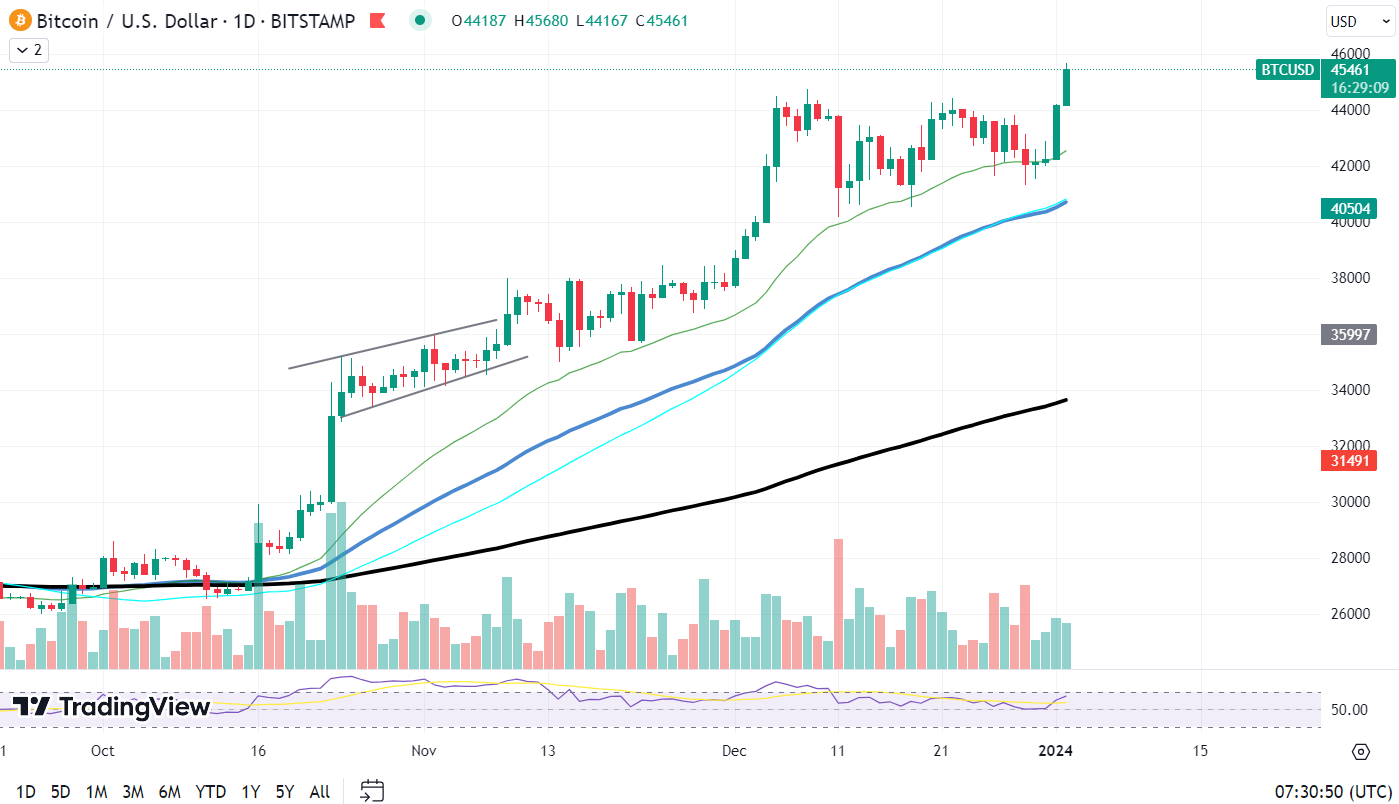
As for Bitcoin's price performance, it is evident that the price has been on an upward trajectory. The chart showcases a clear breakout above the $45,000 resistance level, which has now turned into a support zone. This level was previously a significant resistance for Bitcoin, and overcoming it has been a bullish sign.

The moving averages on the chart present a strong bullish pattern, with the price now well above both the 50-day and the 200-day moving averages, suggesting a strong uptrend. The 50-day moving average, in particular, appears to be acting as dynamic support for the price, indicating sustained bullish pressure.
Volume bars show an increase in trading activity around the breakout point, confirming the momentum behind the move. The Relative Strength Index is ascending toward overbought territory, reflecting the strong buying pressure that has accompanied the recent price surge.

 Arman Shirinyan
 Dan Burgin
 Alex Dovbnya