
Again and again, Ripple does what no one expects: during the weekend, it dropped by more than 5%, and got back to its $0.38 mark. What does it mean for traders? It’s time to buy XRP and enter the race again! Let’s observe how low XRP can go in the following days, and what will be the best strategy to reap profits. Read XRP price predictions from TradingView users.
Descending Channel is confirmed
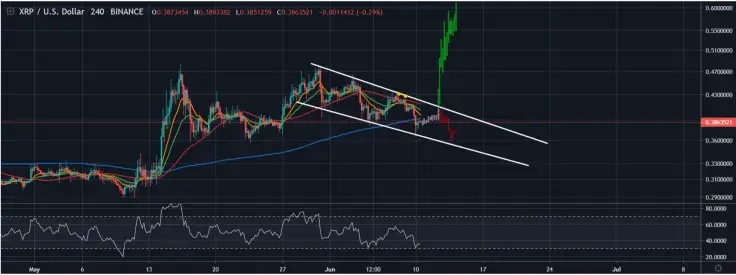
The bearish scenario starts to materialize. XRP/USD has invalidated the ascending triangle formation by testing the lower bound and eventually breaking to the downside. The descending channel was then subsequently confirmed when support was found at the lower bound of the channel.
With the ascending triangle having been broken and the descending channel having been confirmed, we can expect the lower highs and lower lows pattern to continue.
Most likely, a test of the upper bound of the descending channel will take place shortly after consolidation. After that, we should expect a breakout higher to the mid $0.50s to low $0.60s that can take place if momentum picks up and lifts XRP/USD above the price range of the past month.
If this breakout does not occur, the lower highs and lower lows pattern will continue within the descending channel. In such a case, traders should take advantage of this pattern by accumulating at the pattern lows while using trailing stops to catch pattern highs.

Testing the lows: Where’s the true bottom?
Even if you are a patient Hodl type of investor, you need to be aware of your timing on the market. As Get_Some says, “Today is one of those rare days where the stars align.”
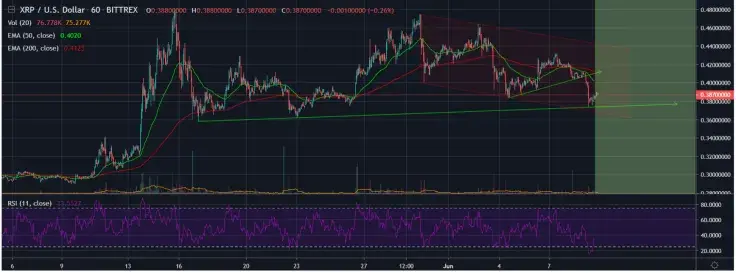
Check out the 1hr chart: the downward trading channel in red is in a solid $0.06 to $0.08 range. The price is dancing above the long-term trend support line in green which is upward. The RSI just plowed under the 20% range. Draw a circle around that price action and you won't get a better buy signal.
Sure, the price may break lower, but that's what stops are for. Right now, the stops are around $0.378 with a $0.375 stop. You can set your trigger alert at $0.38 and watch what kind of down pressure there is. The same strategy can be applied for a swing trade or long-term position.
Yet, you should always fight for the absolute bottom, especially if you're the hodl type. If you’re patient enough, you can even not wait for $0.38, but let the market run you down to $0.25. That’s where long-term price charts come in handy.
XRP/BTC is also getting bearish
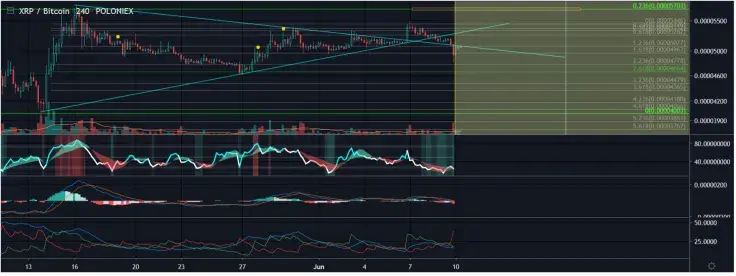
On the 4 hour time frame, XRP/BTC has failed to maintain its value above 200 EMA and looks like it will just cross the uptrend and downtrend lines, which is bearish for the long term. We can see Fibonacci retracement for potential support and resistance for the short term.
What do technical indicators show?
-
DMI spiked up like crazy, while DMX is still weak but starting to pointing upward. It means that the bearish trend will dominate for now.
-
MACD: histogram seller is coming out of nowhere, MACD line starts to go down into the bearish area below zero.
-
MFI is hovering around the oversold/bearish area.
-
Volume MA is slightly rising due to recent seller volume.
Final thoughts
Keep tabs on Ripple charts and don’t miss the opportunity to buy some XRP for a decent profit. You can either do it somewhere around $0.37 or wait till XRP hits $0.32 – it’s a good buy area. Probably, XRP won’t be breaking lower with its strong support line. We've been having higher lows for the past 9 months. When the bearish period is over, our first target will be $0.38 again, then $0.50, of course.
If you’re not the hodl type, stay proactive. You have a chance for a quick 1:2 ratio benefit to get out because there is too much volatility these days, and the market can show us some huge candles in the next weeks. Stay cautious and always use stop losses for margin trading.
Ripple price charts by TradingView
 Dan Burgin
 U.Today Editorial Team