Disclaimer: The opinions expressed by our writers are their own and do not represent the views of U.Today. The financial and market information provided on U.Today is intended for informational purposes only. U.Today is not liable for any financial losses incurred while trading cryptocurrencies. Conduct your own research by contacting financial experts before making any investment decisions. We believe that all content is accurate as of the date of publication, but certain offers mentioned may no longer be available.
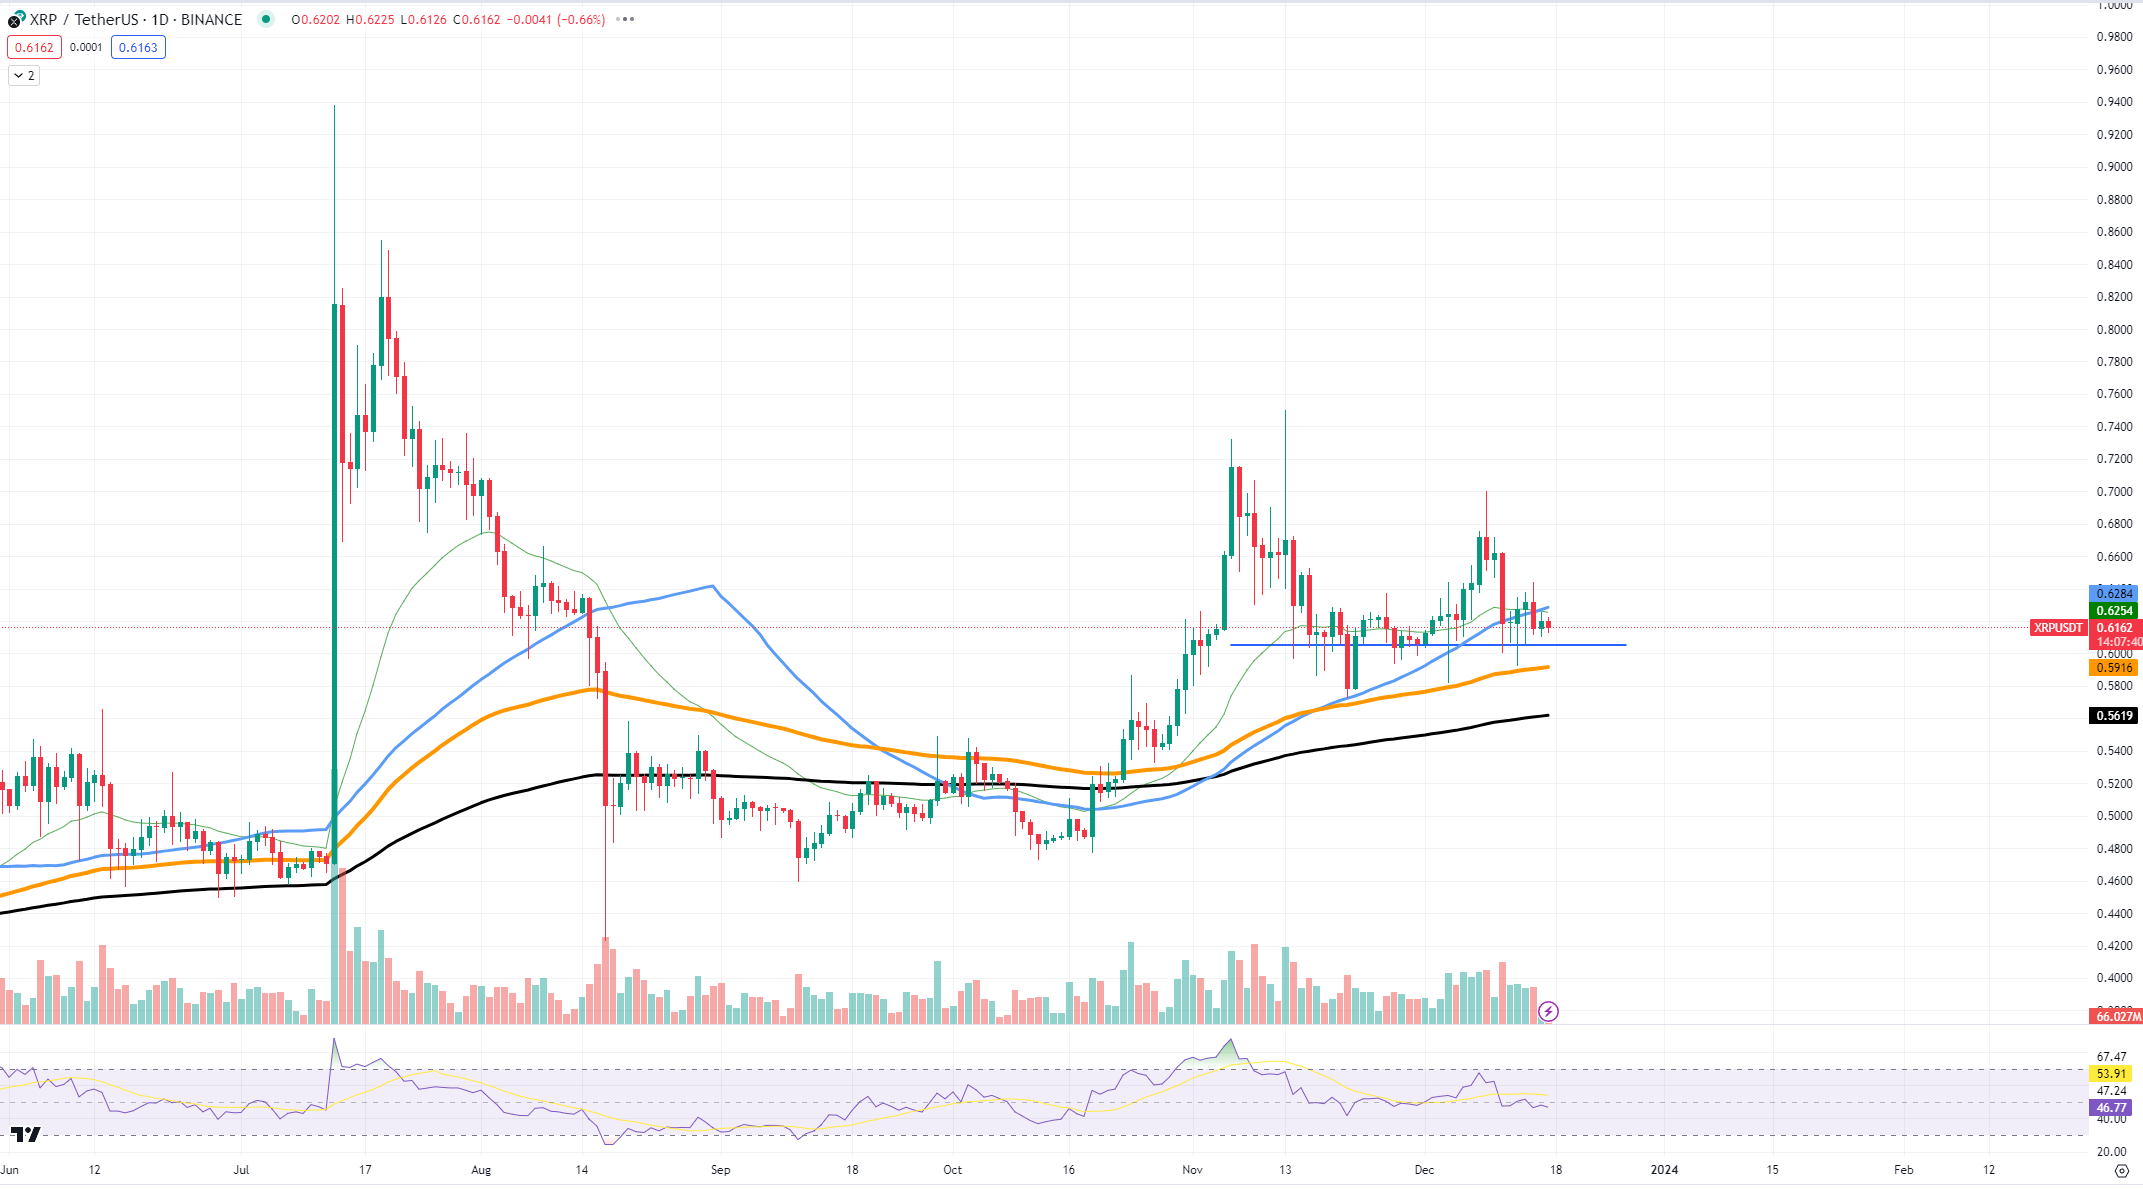
The XRP market is at a crossroads, encountering a critical resistance level that could determine its near-term trajectory. The recent price action on the XRP/USDT chart suggests a potential standoff between bullish momentum and bearish resistance.
The provided chart indicates that XRP is struggling to breach a strong resistance zone. After a period of upward movement, the price has hit a level where selling pressure seems to be mounting, potentially stalling further gains. This resistance is critical because it represents a junction where market sentiment could shift, leading to either a continuation of the uptrend or a reversal into bearish territory.

One concerning sign for XRP bulls is the recent slip below the 50-day exponential moving average (EMA), a tool commonly used by traders to gauge medium-term market trends. Falling below the 50 EMA can often signal that the market is losing upward momentum and that bears are gaining strength. If XRP fails to reclaim this level, it could face further downside.
Despite the current resistance, there are scenarios under which XRP could rally.
Break and hold above resistance: If XRP can break through the current resistance and close above it, particularly above the 50 EMA, this would signal strength and could lead to a test of higher resistance levels, potentially targeting the $0.70 mark, where previous local highs were established.
Bullish market sentiment: A broader market rally, driven by positive news or sentiment within the crypto space, could carry XRP upward. In this scenario, a push beyond $0.65 could see it testing the $0.75 zone, challenging the higher peaks observed in the recent past.
Technical reversal patterns: Should XRP form a bullish technical pattern, such as a double bottom or an inverted head and shoulders, around the current levels, this could attract technical buyers. Support levels to watch in this case would be around the $0.60 range, with potential rallies aiming for the $0.80 resistance, where significant sell orders may be clustered.

 Alex Dovbnya
 Dan Burgin