
Disclaimer: The opinions expressed by our writers are their own and do not represent the views of U.Today. The financial and market information provided on U.Today is intended for informational purposes only. U.Today is not liable for any financial losses incurred while trading cryptocurrencies. Conduct your own research by contacting financial experts before making any investment decisions. We believe that all content is accurate as of the date of publication, but certain offers mentioned may no longer be available.
The prices of most coins keep facing corrections, according to CoinStats.
BTC/USD
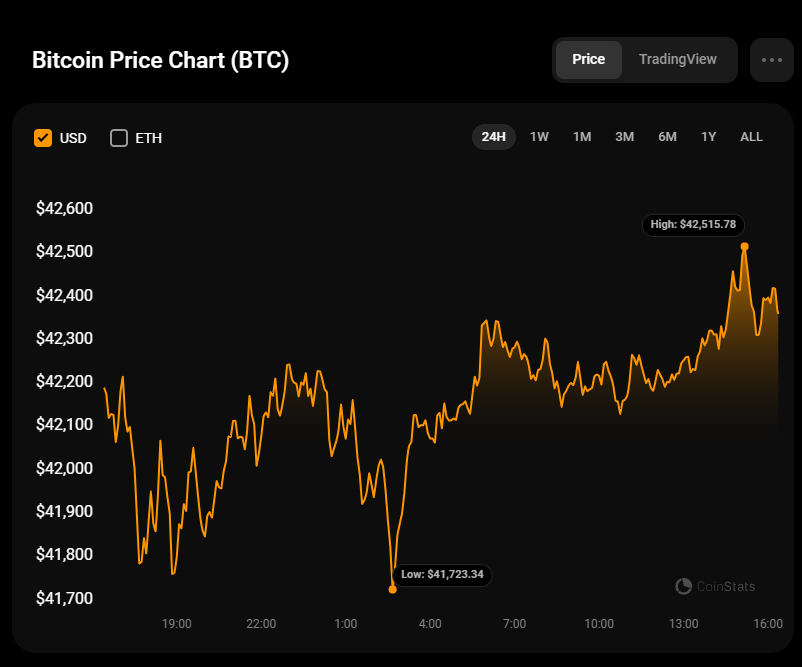
The rate of Bitcoin (BTC) has risen by 0.4% over the last day.
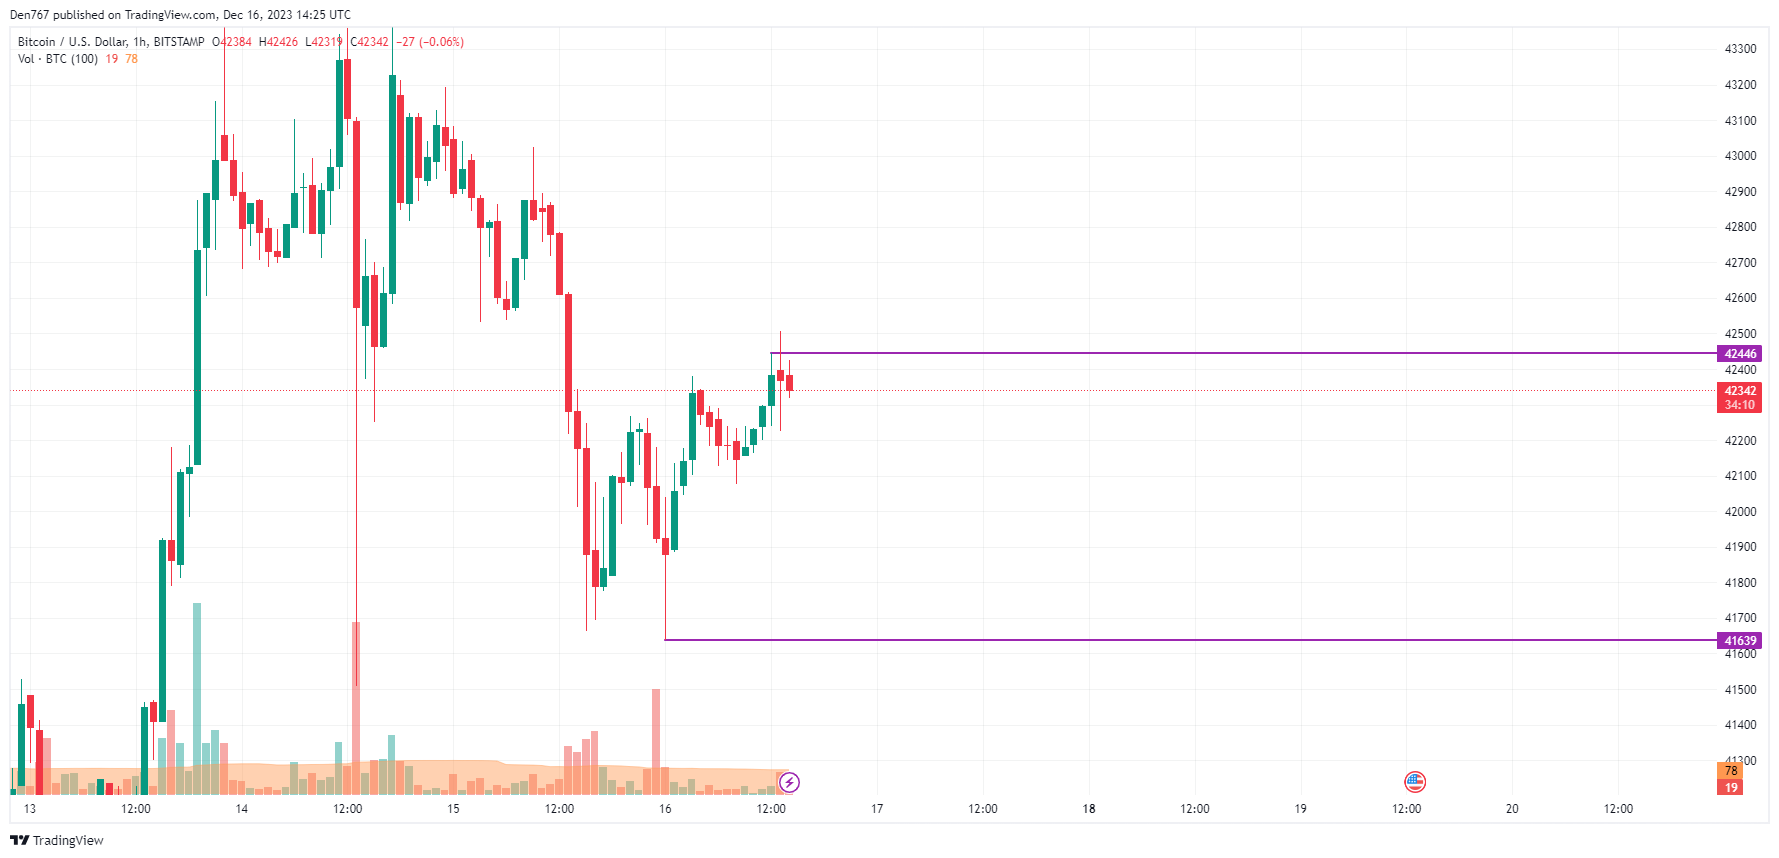
On the hourly chart, the price of BTC is trading near the local resistance level of $42,446. If buyers can hold the initiative, there is a possibility of a breakout followed by a move to the $42,700 zone.
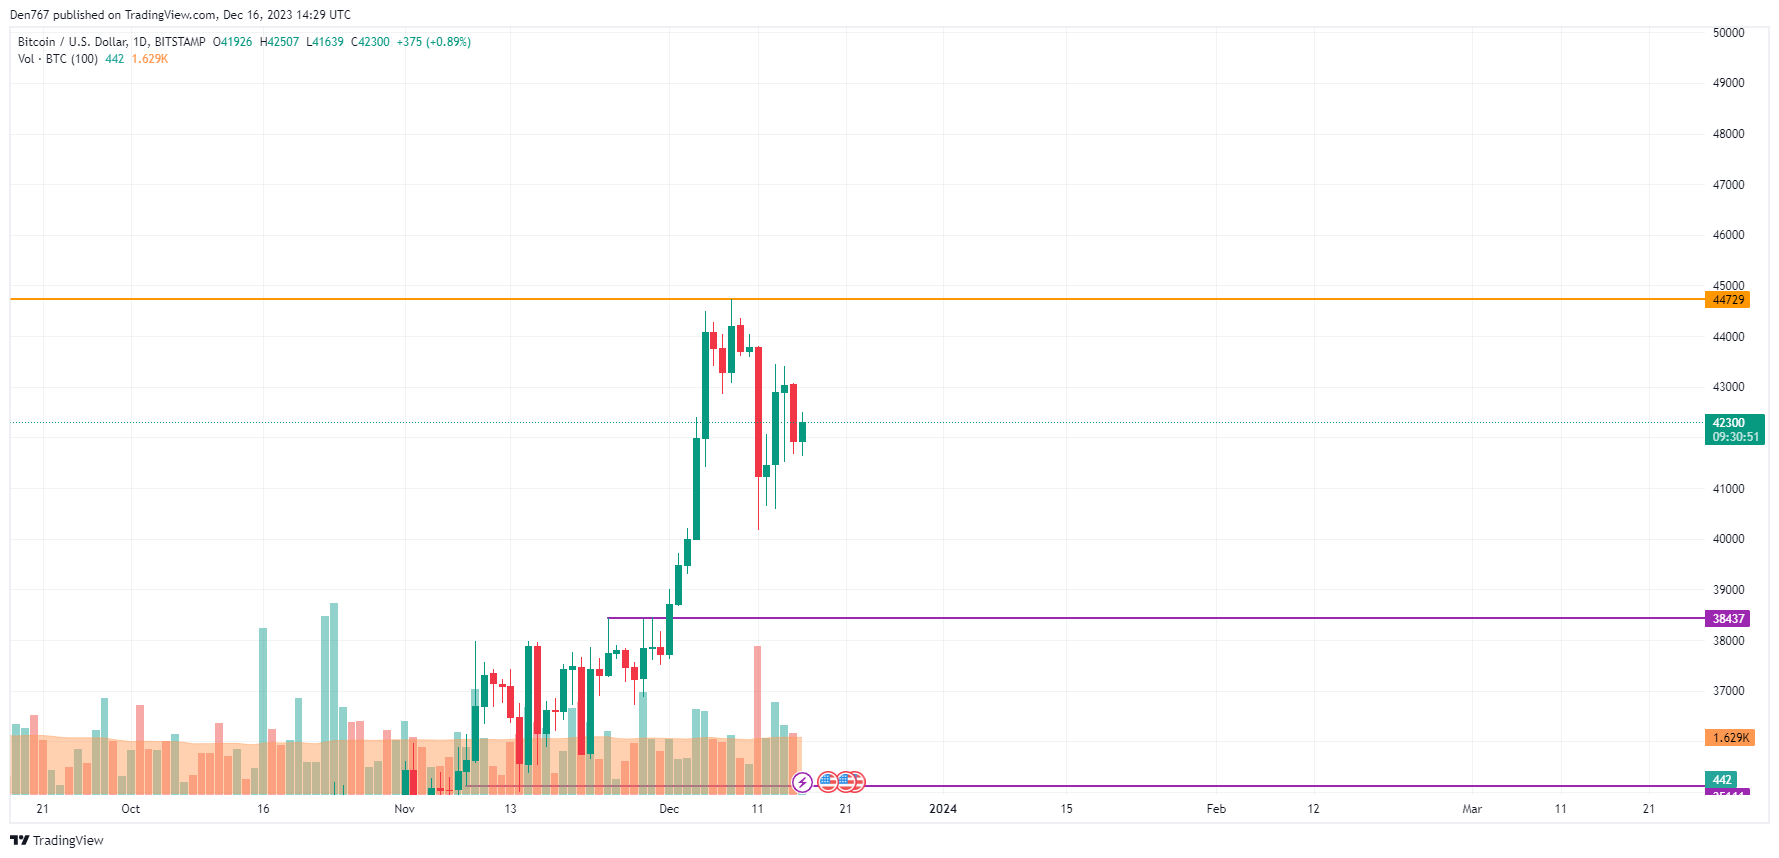
On the bigger time frame, neither buyers nor sellers are dominating as the rate is far from the support and resistance levels.

All in all, ongoing sideways trading between $42,000 and $43,000 is the more likely scenario for the next days.
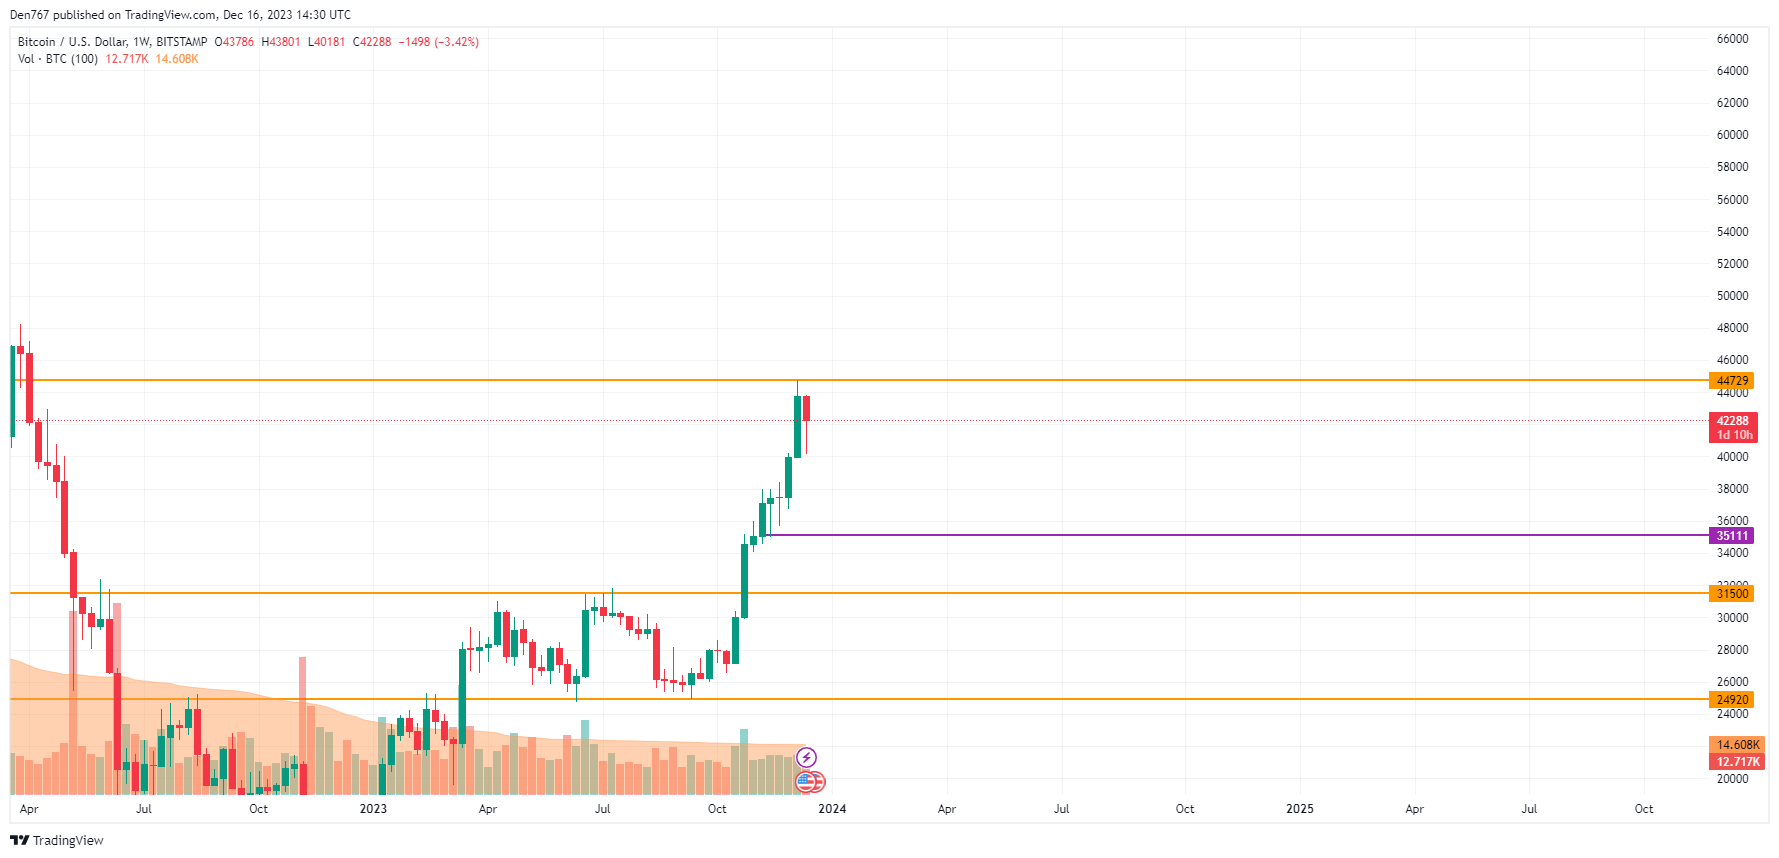
On the weekly chart, bulls could not maintain the rise after the last bullish candle. If the bar fails to close above the $44,000 mark, traders may expect a correction to the $40,000 zone.
Bitcoin is trading at $42,317 at press time.
 Dan Burgin
 U.Today Editorial Team