Disclaimer: The opinions expressed by our writers are their own and do not represent the views of U.Today. The financial and market information provided on U.Today is intended for informational purposes only. U.Today is not liable for any financial losses incurred while trading cryptocurrencies. Conduct your own research by contacting financial experts before making any investment decisions. We believe that all content is accurate as of the date of publication, but certain offers mentioned may no longer be available.
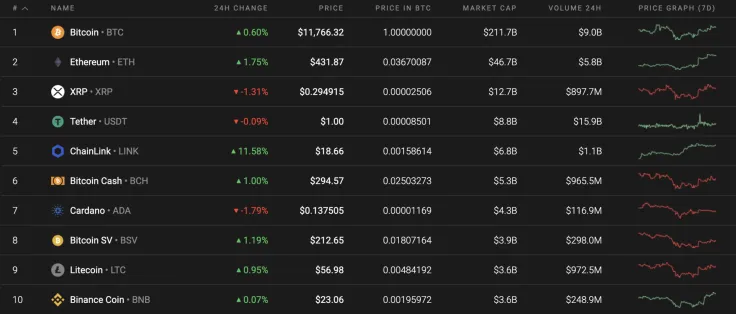
As it usually happens on the weekend, the market is facing a correction phase and today is no exception. This is mainly with regards to XRP and Cardano (ADA), which are both in the red and whose rates have declined by 1.31% and 1.79% respectively.
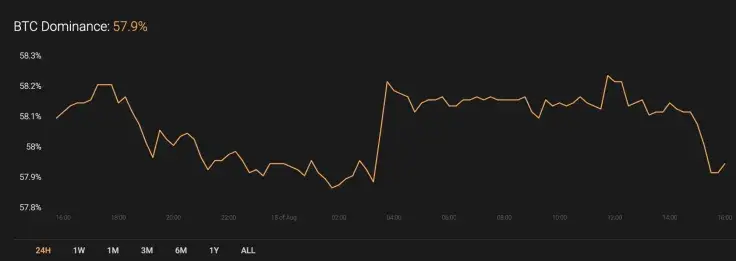
Meanwhile, the dominance rate for Bitcoin (BTC) has gone down slightly since yesterday and now makes up 57.9%.
Below is the relevant data of XRP and how it's looking today:
-
Name: XRP
Advertisement -
Ticker: XRP
-
Market Cap: $13,269,460,752
-
Price: $0.295410
Advertisement -
Volume (24H): $2,232,899,224
-
Change (24H): -1.20%
The data was relevant at the press time.
XRP/USD: Can Bulls Get Back the Rate to $0.30 by the End of Summer?
XRP is the first cryptocurrency from the Top 3 coins to have already entered a correction phase. The third most popular coin has gone down 0.28% since last week.
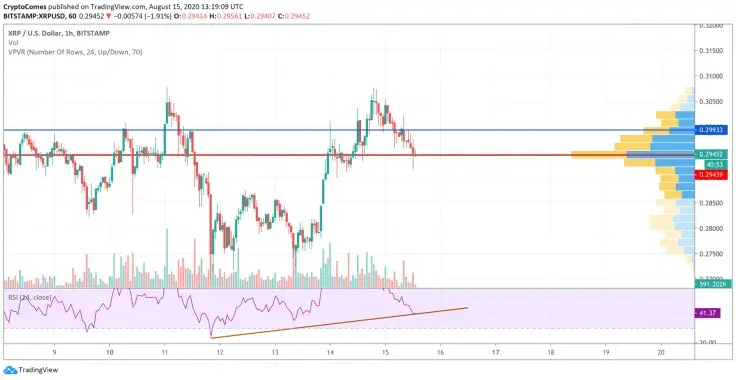
Even though the bears have already seized on the initiative, another bounce back is possible on the hourly time frame. The liquidity level is still high, which means that the bears are not going to give up so soon.
Moreover, there is a bullish divergence on the Relative Strength Index (RSI), which confirms a high possibility for slight growth. In this regard, buyers may push XRP to $0.2993 shortly.
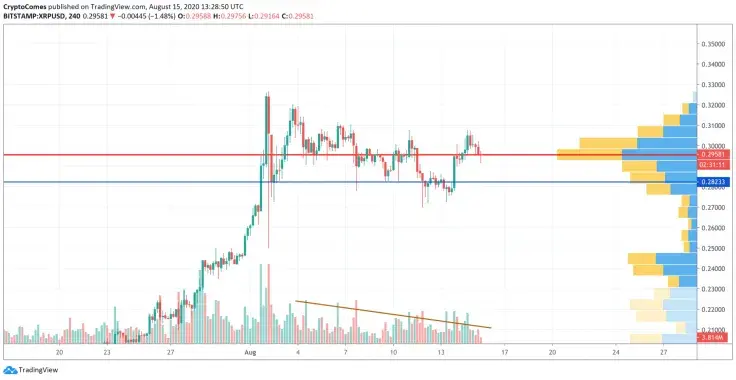
Looking at the 4H time frame, the situation is less positive as XRP has formed a reversal with a target of $0.2823. This level may be reached by the end of the month if the trading volume remains at the same level. Currently, the bears dominate the market and there are real chances that the aforementioned support will be broken if the bulls do not seize on the initiative.
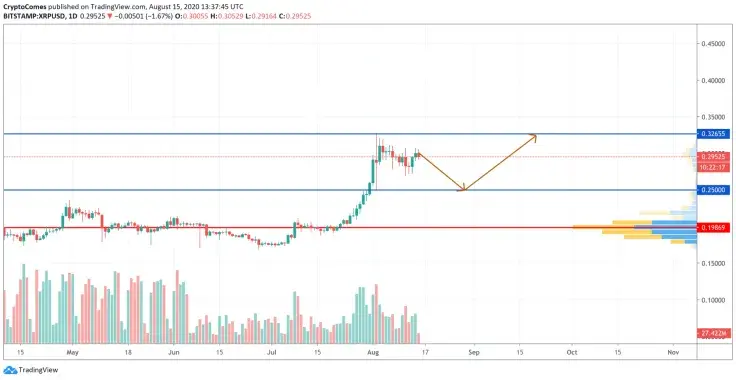
According to the daily chart, the bulls are controlling the situation until XRP is above the crucial $0.25 mark. As the main scenario, traders may expect a drop to $0.25, followed by a rise to its local peak at $0.3265 through the end of September. All in all, the buyers may set new all-time highs (ATHs) if the coin is pushed back to the aforementioned resistance.
At press time, XRP was trading at $0.2948.
 U.Today Editorial Team
 Dan Burgin