Disclaimer: The opinions expressed by our writers are their own and do not represent the views of U.Today. The financial and market information provided on U.Today is intended for informational purposes only. U.Today is not liable for any financial losses incurred while trading cryptocurrencies. Conduct your own research by contacting financial experts before making any investment decisions. We believe that all content is accurate as of the date of publication, but certain offers mentioned may no longer be available.
The Shiba Inu bulls and bears indicator suggests a balance in the play of SHIB buyers and sellers. Shiba Inu persists in sideways trading after reaching highs of $0.000055 on Nov. 30. SHIB is trading down 4.13% at $0.0000354 after yesterday's decline.
The IntoTheBlock bulls and bears indicator tracks the number of addresses that purchased or sold more than 1% of the total amount of volume traded on a given day. ''Bulls'' are those who bought more than 1% of the total volume, and those who sold more than 1% are ''bears.'' The difference between bulls and bears gives an understanding of the net buying/selling activity by large players.
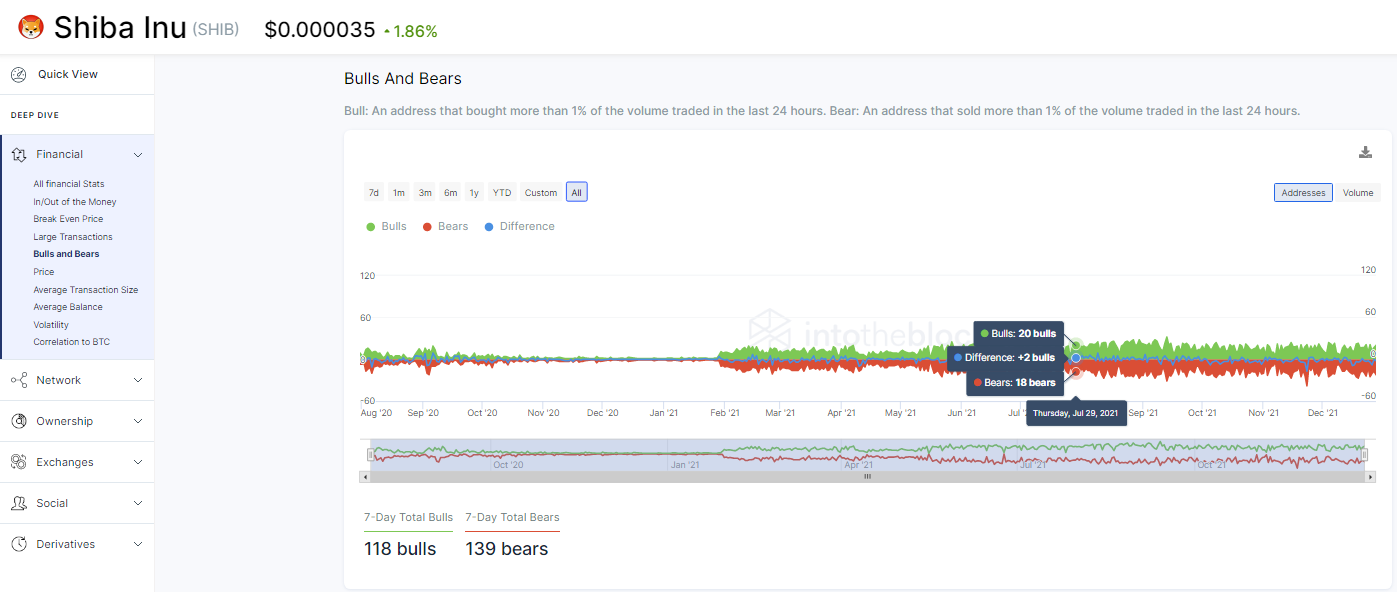
Based on the address count, Shiba Inu bulls and bears continue to tussle, with the bears gaining the upper hand in the last seven days. The volume view, which aggregates the total amount purchased by bulls and sold by bears, however, points to something quite interesting.
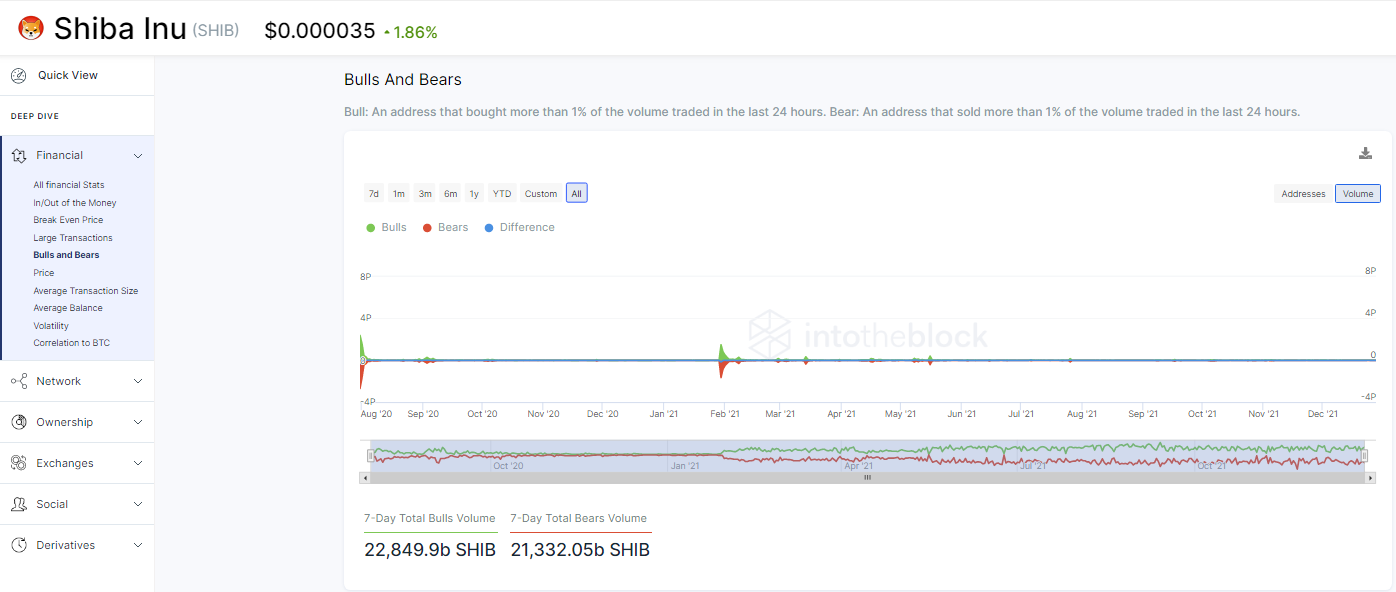
Over the last seven-day period, a total amount of 22.84 billion SHIB has been bought by the bulls, while 21.33 billion SHIB have been sold by bears. Overall, the quantity of SHIB bought in the last seven days has surpassed that sold by nearly 1.51 billion, which is a positive sign.
Shiba Inu price action
The relative strength index (RSI) is a momentum oscillator used to estimate the overbought or oversold conditions of an asset.
The RSI on Shiba Inu's daily chart is hovering near the 50 neutral mark, which suggests possible consolidation or sideways trading. This also might suggest that the advantage goes to neither bulls nor bears.
Shiba Inu could be said to have had an impressive 2021 so far, up 62,693,461.1% from November 2020 all-time lows. As the year drags to a close, Shiba Inu could take time to consolidate and reminisce while pondering the next move for 2022.
Shiba ranks 13th largest cryptocurrency by market capitalization with a trading volume of $1.35 billion in the last 24 hours, according to CoinMarketCap data.
 Dan Burgin