
*** Please note the analysis below is not investment advice. The views and opinions expressed here are solely those of the author and do not necessarily reflect the views of U.Today. Every investment and trading move involves risk, you should conduct your own research when making a decision.
Bitcoin weekly scenarios
Weekly chart
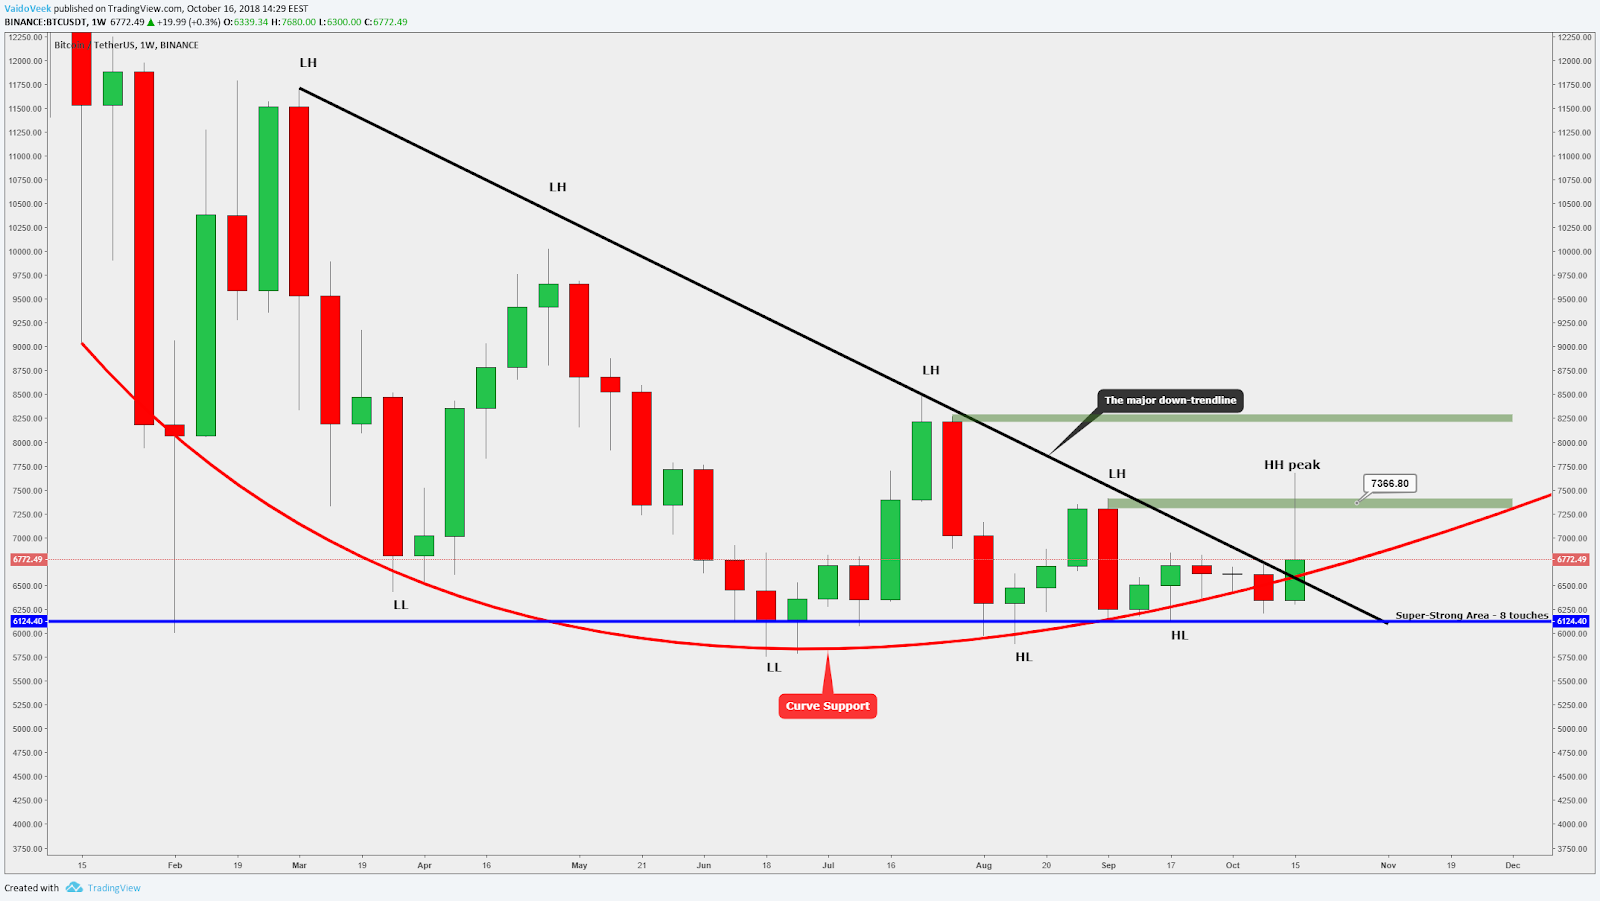
Bitcoin has made a breakout from the major down-trendline which is a pretty important sign for the cryptocurrency. Yesterday, it made very big moves at exchanges where crypto-fiat trading is provided. That happened due to the USDT crash, but currently, things have settled down and we may do a technical analysis for Bitcoin and some altcoins.
On the weekly frame, trading is above the major down-trendline, and the highest high peak was reached. The highest high got confirmed on the one-hour time frame where it made a quick close above the previous level.
Daily chart
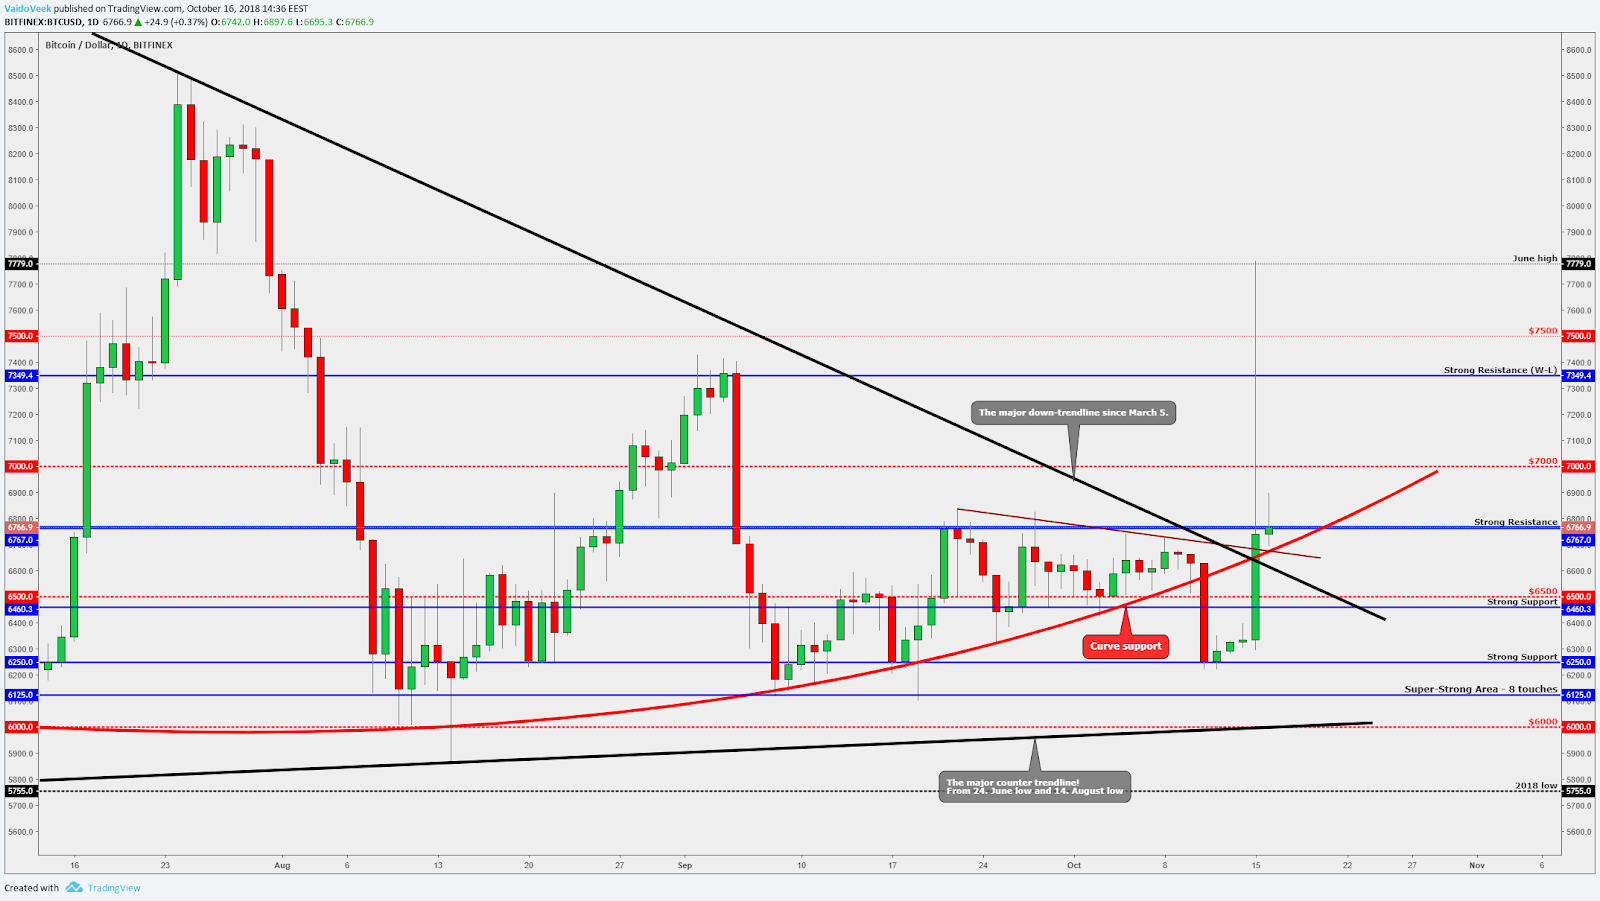
Yesterday’s candle close was above some important levels: above the round number $6,500, above the curve support and above the major down-trendline. One and the most significant level was unbeatable at $6,767 but the most important sign is that the candle closed above the major down-trendline. It will show that technically the power is there and buyers manage to hold the price above the trendline.
Speaking of the further action, the first blue line above the current price is the key level. That is a possible scenario; however, power is needed to acquire this level.
Then we could see a movement to the $7,000 and to $7,400 because currently, there are not so much heavy resistances to stop us. The road is definitely not as fast and smooth as it was yesterday. Step-by-step, resistance after resistance.
Four-hour chart
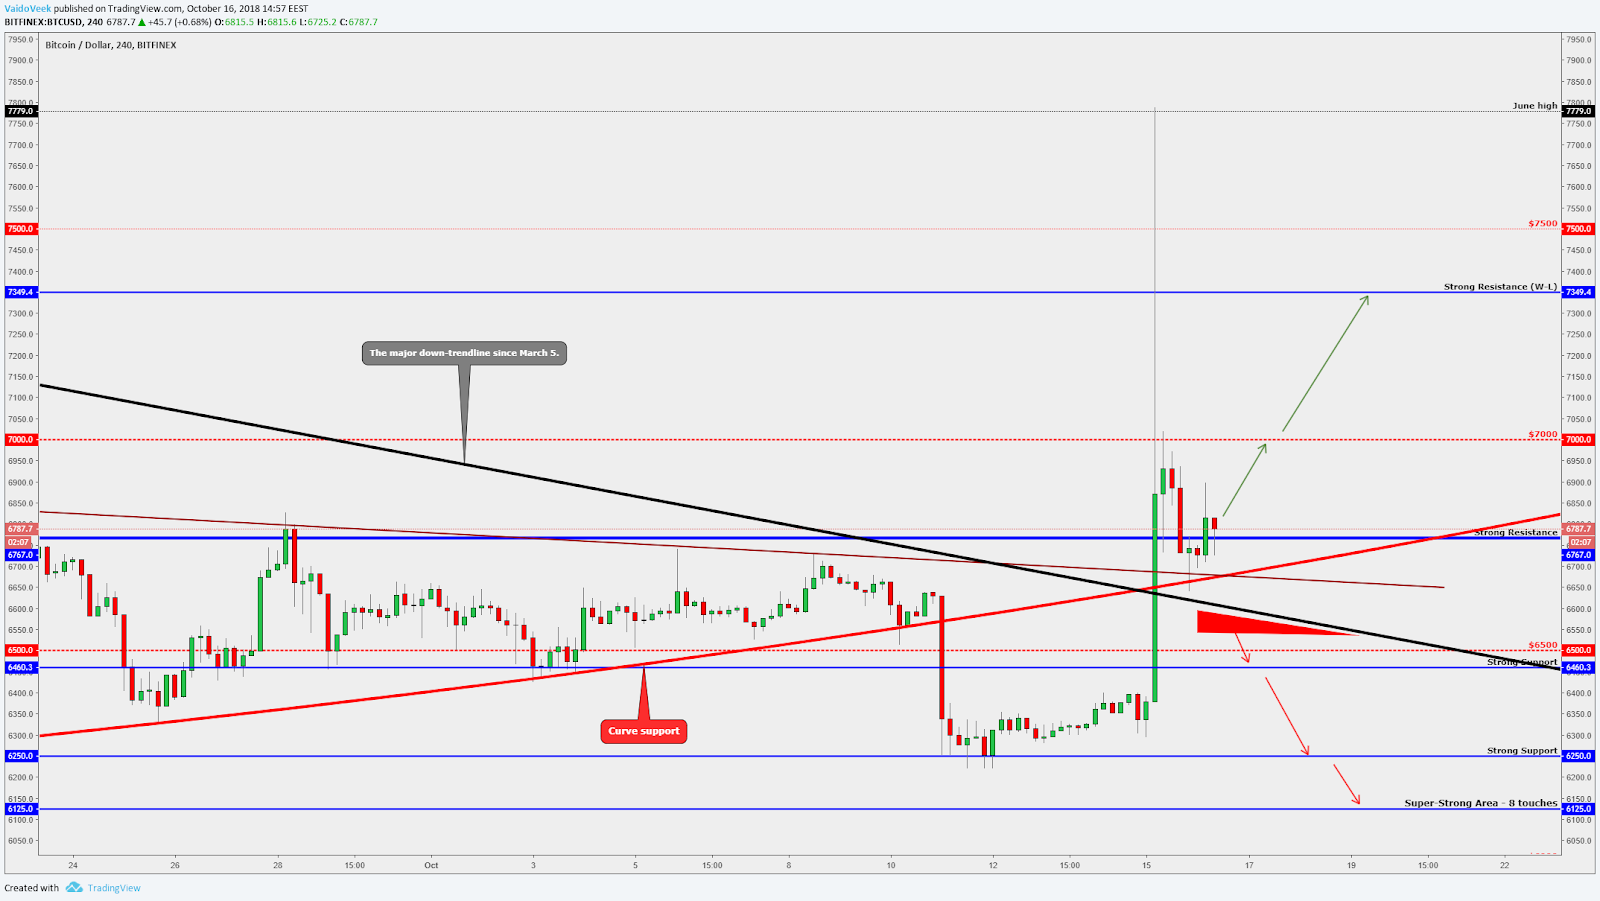
Yesterday we got pretty quick throwback which is not a good sign, but luckily, today we have seen positive actions from important price levels. The price fell down to the super-strong crossing area around $6,700. The major down-trendline, the curve support and the minor trendline pulled from Sept. 22 have met at this point.
The price reacted quickly, and after the close, it formed a bullish “Hammer”, a little consolidation and currently, we fight again with the strong resistance (the blue line at $6,767). If this move upwards is a long-lasting one, then it would be the key point. The retest area (crossing area) was that important because, after the breakout, the price almost always makes a retest, and the climb may continue after that, so as it does now.
In the night, there was some awaiting what is going to happen next. Altcoins were slightly on the red side, and BTC was ready to make a little move. After some raise, Ripple was first to take an action and started to climb higher pretty quickly. Now almost all the altcoins are on the green side to support this breakout from the strong resistance area.
Let’s talk about Bitcoin possible scenarios.
Bullish scenario:
Firstly, the retest, which ended with the “Hammer” pattern, has to hold us, and secondly, we have to take down the strong area at $6,767. This is the first guideline to the higher prices because lately, this level has played a significant role. It has been unbeatable resistance point multiple times and if it finally breaks, we might see a nice move upwards to the next round number $7,000 and from there to the $7,400 higher high point.
Bearish scenarios:
1. A candle closes below the curve support.
2. A candle closes below the brown short-term trendline.
3. A candle closes below the major down-trendline.
Those are the most important supports below the current price, and if the price reaches below the aforementioned levels, then it would be a bad sign. Those criteria make together a strong crossing area, and crossing areas are always the key levels. At least, a four-hour candle closed around $6,550 gives us a break below from the crossing area and leaves only the round number $6,500 which has to hold the ‘fall train’ from falling any further.
Cardano weekly scenarios
Weekly chart
Let’s start from the weekly time frame (the image below). This week Cardano has found a support from the round number at $0.07. This level also worked as a nice support in September because after the rejection from the round number, ADA got a strong push upwards, showing 35 percent growth.

Around this $0.07, there is also a Fibonacci golden ratio of 62 percent which indicates that currently, the bounce occurred from the perfect area. Yesterday, it got a solid bounce upwards and found a resistance from another round number at $0.08 and from August low point which works now as a resistance.
Daily chart
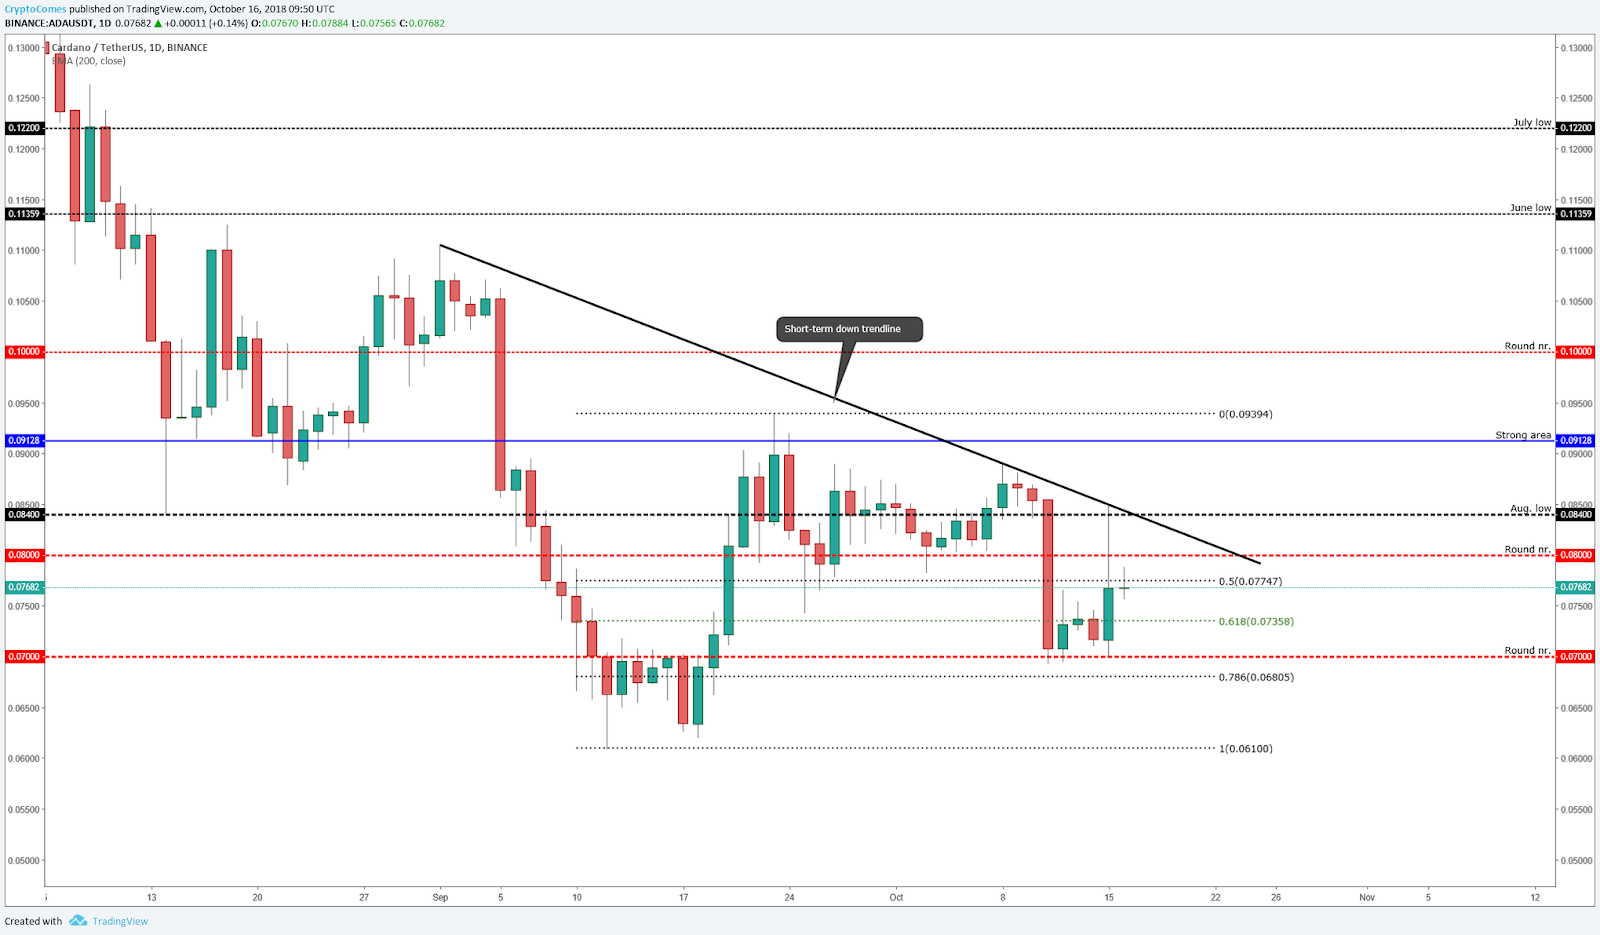
A daily time frame (the image above) shows that the rejection downwards came from the August low and from the short-term down-trendline crossing area which makes this area pretty hard to beat. Currently, Cardano consolidates between the two round numbers and waits for further Bitcoin general actions. The platform (support bounce) is pretty good to make another leg upwards and to attempt to break above the short-term down-trendline one more time.
Four-hour chart
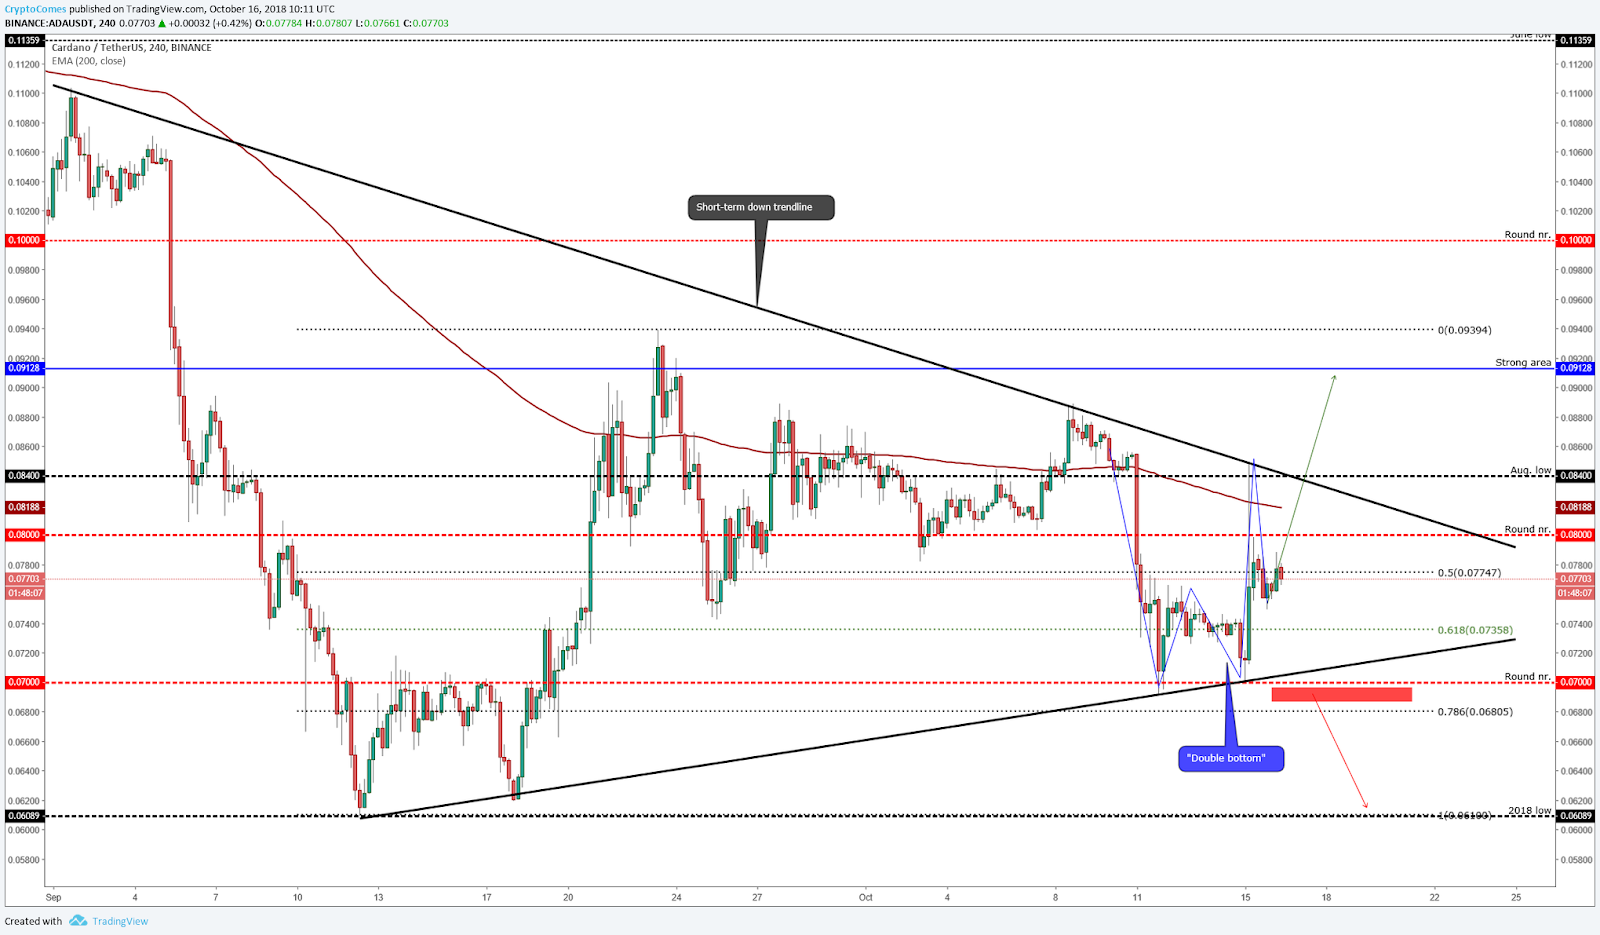
Now let’s dig into the four-hour chart (the image above) to clarify some confirmation areas to predict further movements. In the bigger picture, it shows that we are between the two short-term trendlines which together make a chart pattern called “Triangle”.
Bullish scenario:
On the image, there is a chart pattern called “Double bottom”. The double bottom has formed on the round number area at $0.07, which means that we have bounced upwards two times from the same area. Currently, it has made a retest at the pattern breakout area and the textbook says: “Buy the breakout when you have seen the retest.”
At the moment we have a retest, and this bullish pattern is an indication that our platform is good to go higher IF the market allows it.
To get more confirmations, first of all, we have to break above the round number $0.08 and above the 200 EMA. Those two are our main obstacles before approaching the short-term down-trendline (the triangle) which is also the key to the higher prices. If we got a breakout from the triangle, then we are out of the short-term downtrend and ready to fight with the higher levels resistances at $0.091 and the big round number at $0.1.
Bearish scenario:
If the market and Cardano start to show some weaknesses, then we drop back into the $0.07 area. There are some great supports for us: the round number and the short-term up-trendline (the triangle bottom line). Those two make a crossing area, and if we see a close below the round number and below the trendline, then it would be a bad sign for Cardano. That will mean that momentum is gone and we have broken below the triangle. That will be definitely an ‘alert’ sign. A close below the mentioned levels will guide us to the 2018 low point at $0.06.
Ripple weekly scenarios
Weekly chart
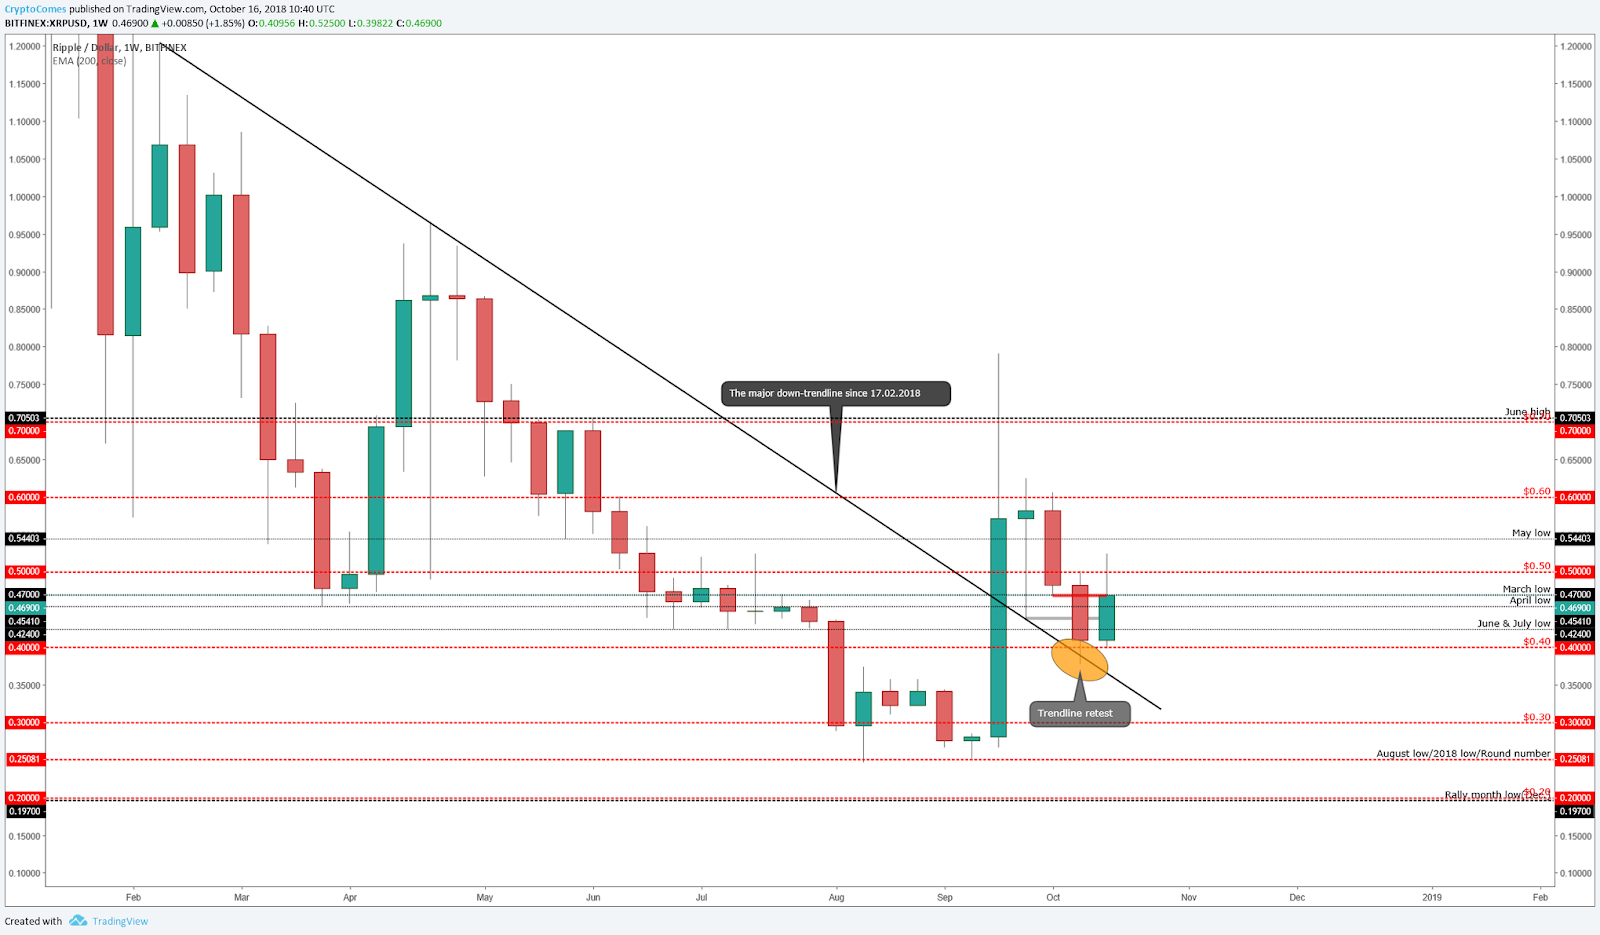
Lately, Ripple has shown incredible growth compared to other altcoins and currently, it makes a throwback (movement downwards) from its peak on Sept. 21. Last week it found support from the major down-trendline, which is pulled from Feb. 17, and worked as in a textbook: the strong candle made a breakout, and last week we made a retest and it bounced upwards pretty nicely. We predicted this scenario in one of our earlier posts mentioning that we might see a bounce upwards from the round number at $0.04. The massive amount of the bounce happened yesterday when XRP made a 25%+ growth just in minutes and currently, it has found a resistance from the $0.5, but we have lots of supports below the current price which will make this coin a little bit more stable.
Daily chart
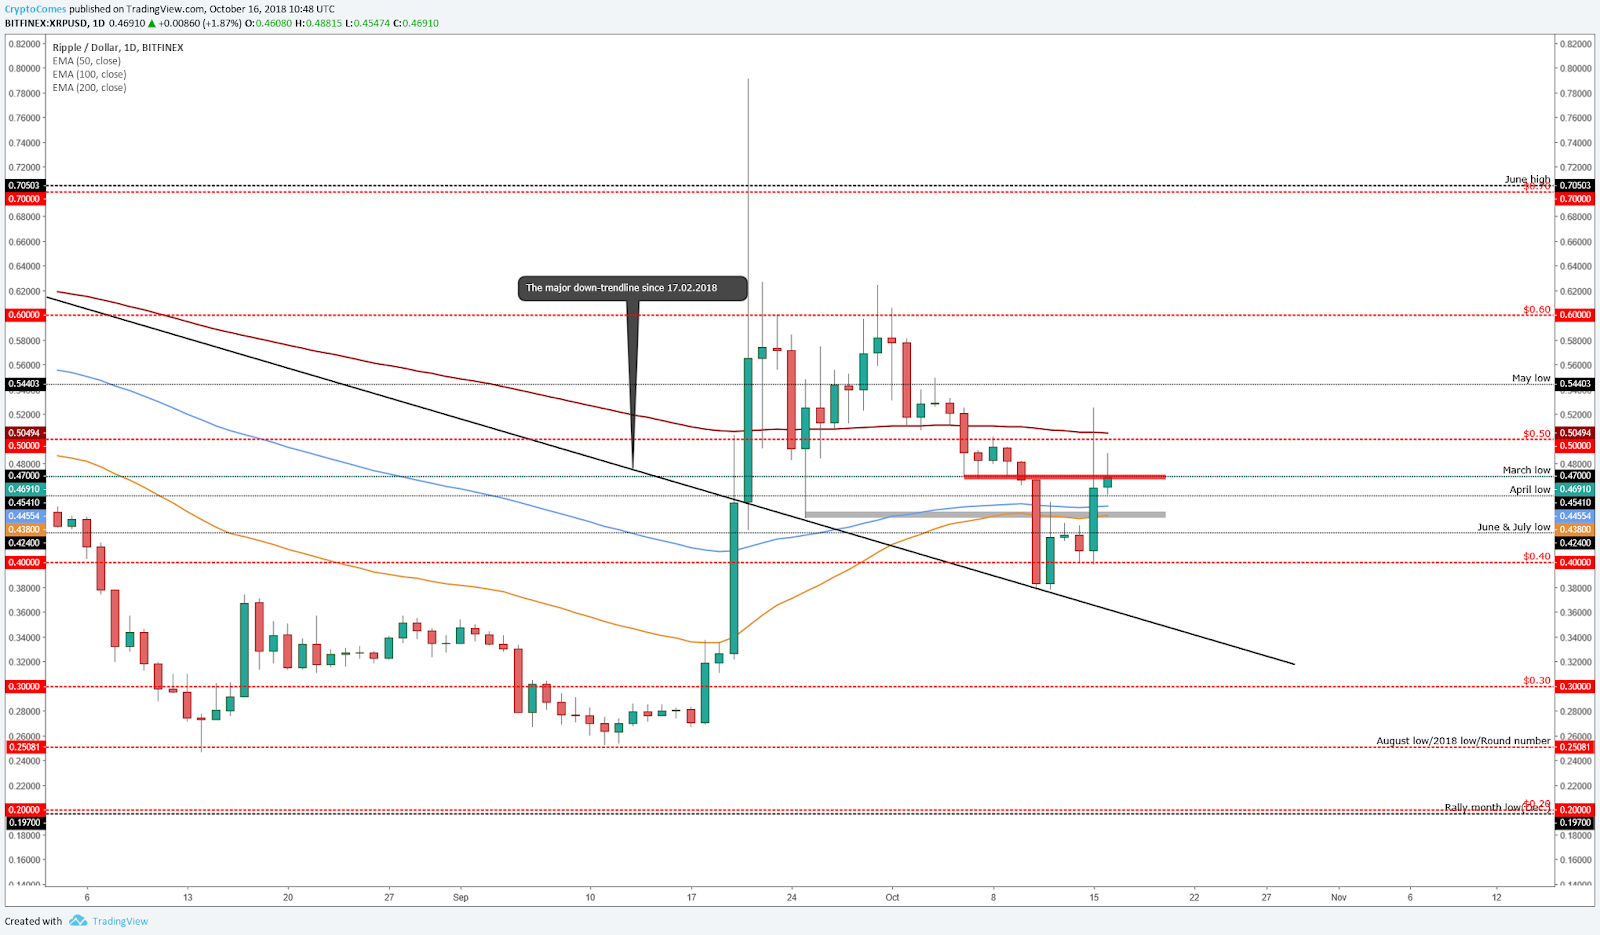
On the daily chart, we could see that we trade above the 50 and 100 EMA’s, but it is the 200 EMA that works as a resistance. It matches almost exactly with the round number $0.5 which also works as a resistance, and together they make a pretty strong price level. Currently, the price fights with the old support levels which now becomes resistance. Yesterday candle closed below the red box, and it shows that this level works pretty well, so this is the first resistance that we have to take down if we want to see higher prices; a daily candle closed above the box will confirm that breakout. The box price range is around $0.47.
Four-hour chart
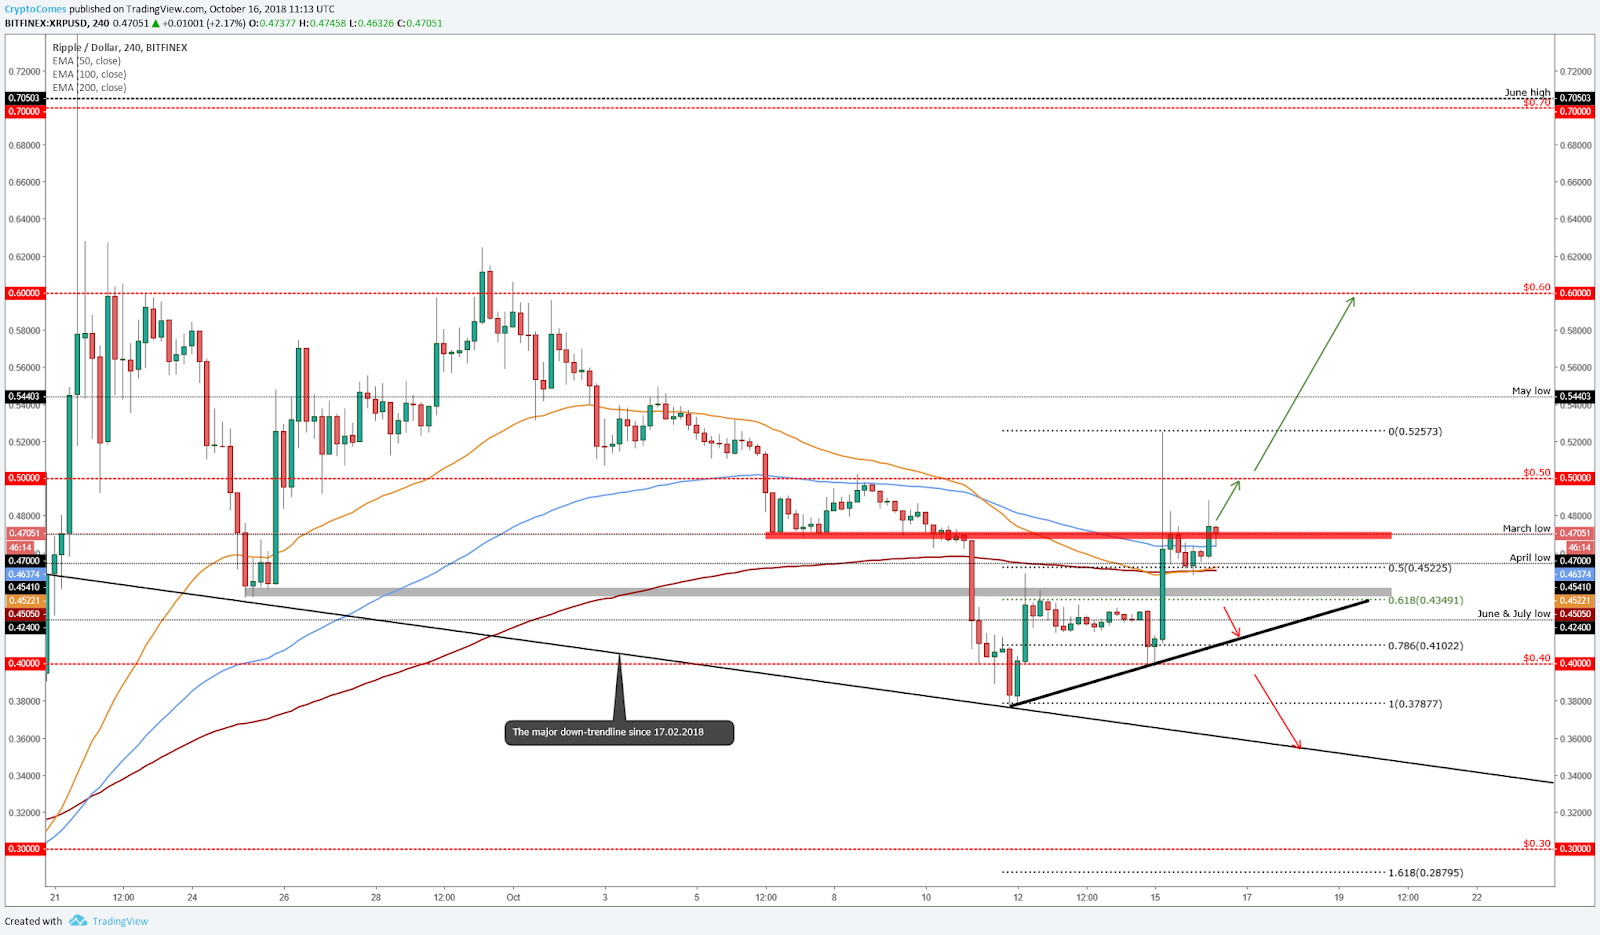
Yesterday we got a push upwards and the big bounce was technically from the pretty good area: from the Fibonacci golden ratio of 62 percent and from the round number $0.04. The bounce guides us to higher prices, and now let’s consider possible scenarios at the current level.
Bullish scenario:
We have made our first steps towards higher prices, the last four-hour candle has closed above the earlier mentioned red box which previously was the support. Positive signs are also that the price is above the EMA’s which will support this move upwards pretty strongly. The red box matches exactly with the March low point and currently, the price makes a retest. If the next four-hour candle closes above the box, then it will confirm that the retest was successful and the coin is ready to go higher, but once again, only if the market allows this.
Next resistance is not far from the current price — it is the round number $0.5 which has worked previously as a resistance. If you see at least a four-hour candle closes above the round number, then it would be a confirmation to go to $0.6. The road to the $0.6 is not hard because there are not so many significant resistances before that round number. So, firstly a nice retest candle guides us to the $0.5 and if you see at least a four-hour candle close above $0.5, then it should guide us to the $0.6
Bearish scenario:
Between $0.4 and $0.5 we have multiple important levels, and currently, they all work as support levels — March low, April low, June and July low and the round number $0.4. This makes us a little bit more secure as we know we have so much supports under the current price, but let’s name some of the bearish confirmation areas:
1. A candle close below the red area.
2. A candle close below the EMA’s.
3. A candle close below the gray support area and below the Fibonacci 62 percent.
Those levels are steps to the short-term counter trendline. If the trendline level breaks, then we can assume that the round number $0.4 doesn’t hold us anymore and we probably could go and test the lower levels.
If this scenario occurs, then we might go and retest again the major down-trendline but currently, a close below the gray and Fibonacci 62 percent area will be definitely bad signs.
 U.Today Editorial Team
 Dan Burgin