Disclaimer: The opinions expressed by our writers are their own and do not represent the views of U.Today. The financial and market information provided on U.Today is intended for informational purposes only. U.Today is not liable for any financial losses incurred while trading cryptocurrencies. Conduct your own research by contacting financial experts before making any investment decisions. We believe that all content is accurate as of the date of publication, but certain offers mentioned may no longer be available.
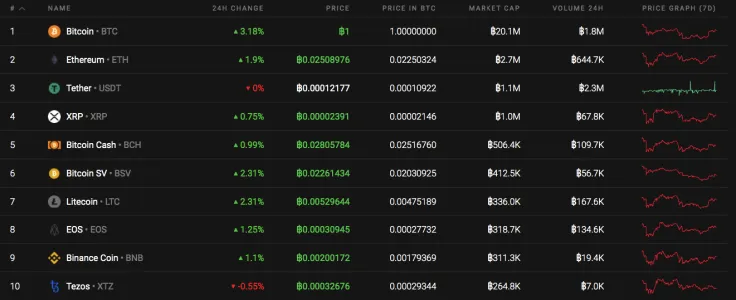
Cryptocurrencies are continuing to adjust; serious movements have not yet occurred. All of the top 10 coins are in the green zone except for Tezos (XTZ), which has lost 0.55% of its value over the past day.
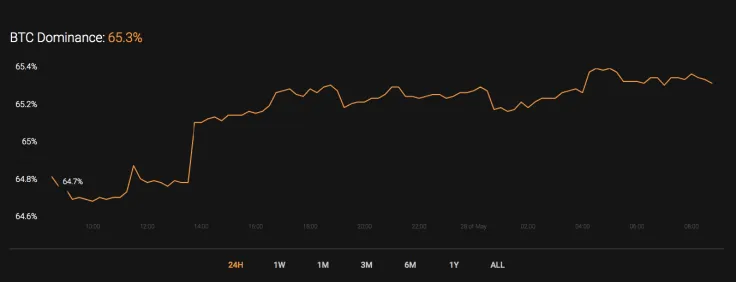
The current sharp rise of Bitcoin (BTC) has affected its market share, which has increased since yesterday and is now 65.3%.
The relevant data for Bitcoin is below.
-
Name: Bitcoin
Advertisement -
Ticker: BTC
-
Market Cap: $168 556 826 014
-
Price: $9 166.91
Advertisement -
Volume (24h): $32 482 666 215
-
Change (24h): 3.29%
The data is relevant at press time.
BTC/USD: Will the ongoing growth lead to $10,000?
On the 4H chart, Bitcoin (BTC) continues to move within the framework of the Triangle model. In the near future, the values of the RSI indicator might once again test a downtrend, which may trigger a price bounce down and a continued fall. This idea will be confirmed by overcoming the support level and holding the price below $8,450, which will lead to a breakdown of the lower boundary of the Triangle model.
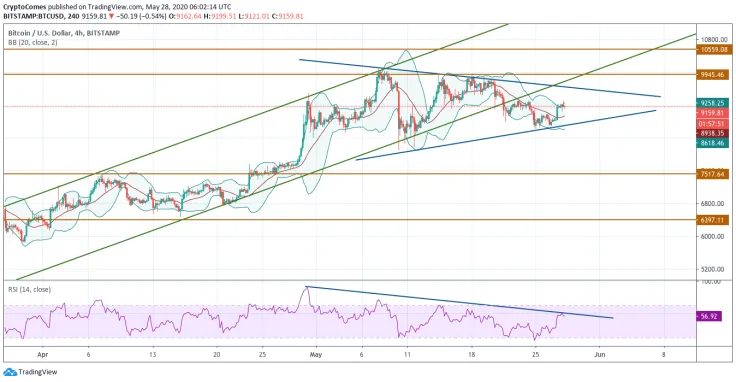
A second possibility is a breakdown of the upper boundary of the model with the price holding above $9,950, in which case we could expect a continuation of the rise for further development of the pattern.
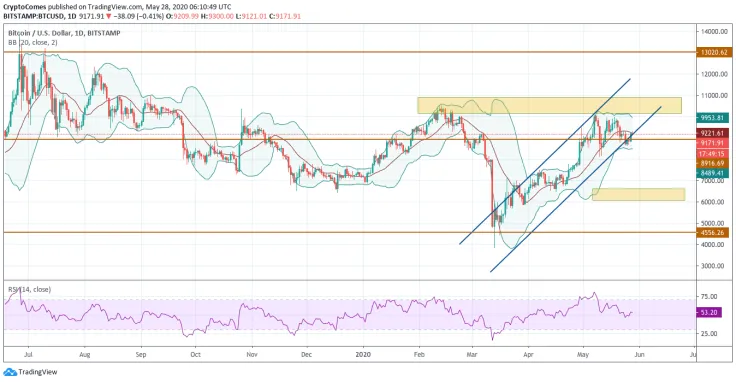
On the daily time frame, the quotes have continued to remain at an important level of resistance. For the first time in this entire rise, the price has broken down through an upward trend line, which has long been a key support. Most likely, pressure from bears is beginning to grow, and there is every chance of seeing a fall to $6,400, where an inverted Head and Shoulders model will be completed.

The breakdown of the support line on the RSI indicator also favors the option of falling quotes, which may indicate the possibility of the closing price holding below $8,015. To overturn this negative scenario and continue the steady growth of the asset value, it is important for bulls to gain a foothold above $10,565.
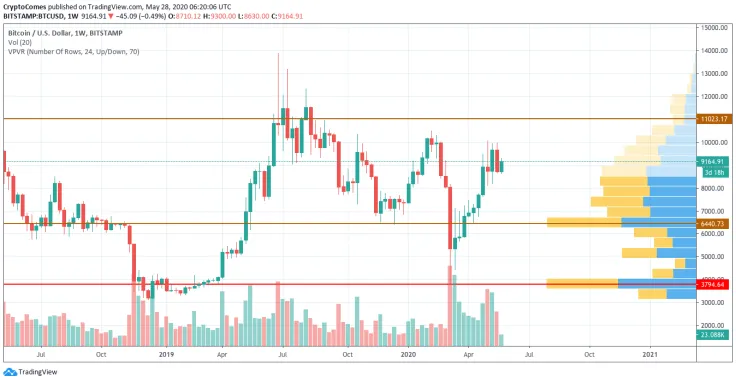
On the weekly chart, the current candle is of great importance. If it closes above the previous one, traders can expect to see Bitcoin (BTC) in the area of $11,000 in the first days of June. If it fails to do so, the nearest support zone will be $6,400. From a technical perspective, there are few chances for the main crypto to get to $11,000, due to declining trading volume and low liquidity.
Bitcoin is trading at $9,160 at press time.
 Dan Burgin
 U.Today Editorial Team