
Disclaimer: The opinions expressed by our writers are their own and do not represent the views of U.Today. The financial and market information provided on U.Today is intended for informational purposes only. U.Today is not liable for any financial losses incurred while trading cryptocurrencies. Conduct your own research by contacting financial experts before making any investment decisions. We believe that all content is accurate as of the date of publication, but certain offers mentioned may no longer be available.
The weekend started with the ongoing correction as most of the Top 10 coins were in the red except for Chainlink (LINK), which rose by almost 5% yesterday.
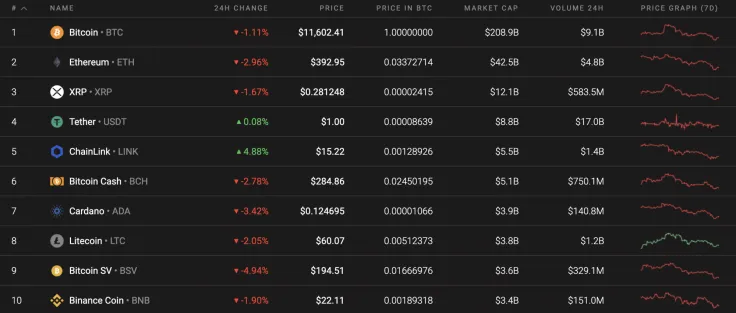
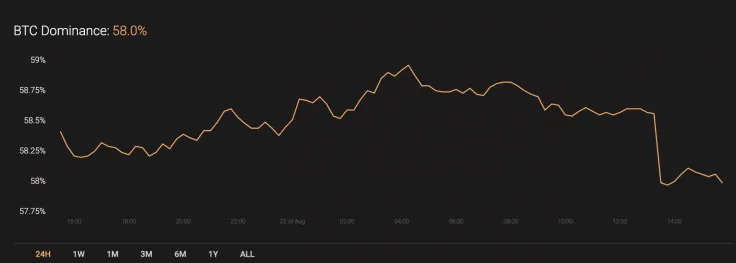
Meanwhile, the dominance rate for Bitcoin (BTC) has declined slightly since yesterday and its current index sits at 58%.
Below is the relevant data for Bitcoin (BTC) and how it's looking today:
-
Name: Bitcoin
Advertisement -
Ticker: BTC
-
Market Cap: $214,353,383,304
-
Price: $11,606.89
Advertisement -
Volume (24H): $24,290,199,536
-
Change (24H): -1.47%
The data was relevant at press time.
BTC/USD: Can One Expect Another Retest of $11,500 Before Continuous Growth?
Bitcoin (BTC) has confirmed the lack of strength by the bulls as buyers could not fix above the $12,000 mark for a significant amount of time. The rate for the leading crypto has dropped 2.17% in the last 7 days.
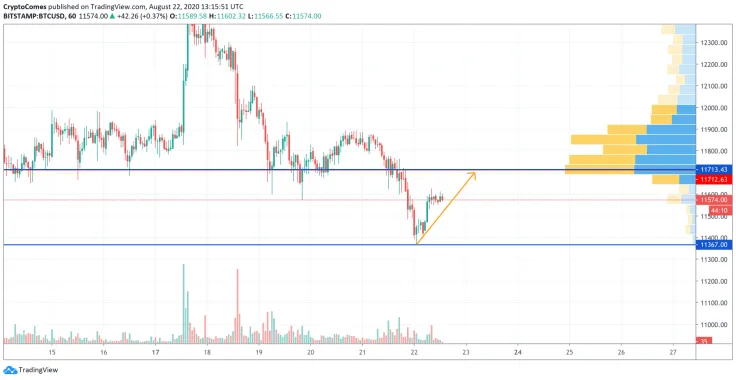
Looking at the hourly chart, Bitcoin (BTC) bounced off its $11,400 support zone. The decline did not continue further due to the low selling volume.

Even though the correction may not have ended, one must consider a short-term rise in liquidity to the $11,700 mark. Rather, it is a correction after a sharp decrease and not the start of a continued bull run.
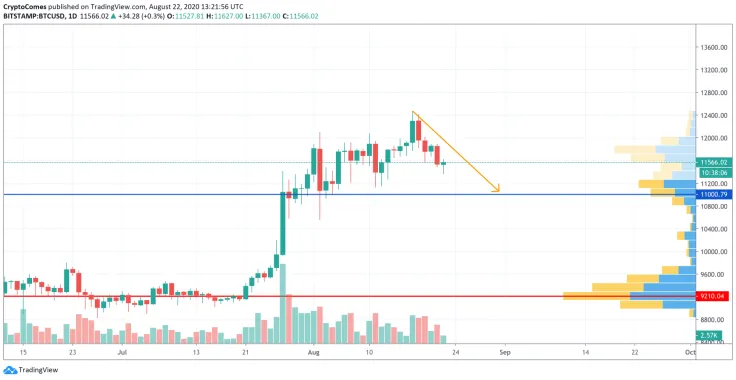
Looking at the bigger time frame, the bearish scenario is still relevant as the trading volume continues to go down, which does significantly affect the rate of Bitcoin (BTC). The liquidity level is also low, which means that the nearest support where the bullish trend may continue is at the $11,000 mark.
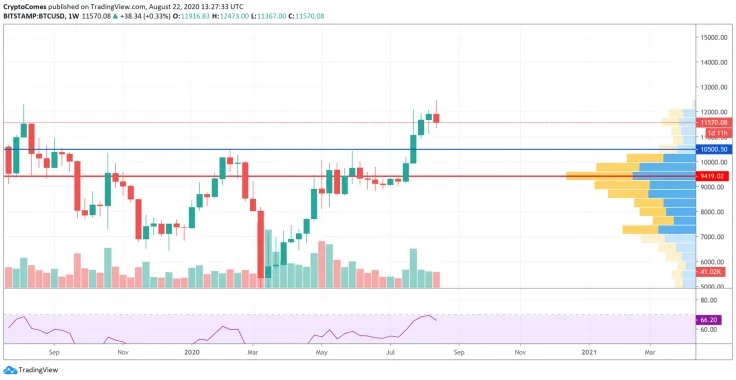
Looking at the weekly time frame, the situation is almost identical. The bears have seized on the initiative, and within the upcoming weeks, are likely to be bearish. Furthermore, a bearish divergence is forming on the Relative Strength Index (RSI), which considers the ongoing price drop. Moreover, the trading volume remains at the same level, which is also a signal of a decline. If the bulls do not hold at the $11,00 mark, then the next stop is $10,500.
At press time, Bitcoin was trading at $11,587.
 Dan Burgin
 U.Today Editorial Team