
Disclaimer: The opinions expressed by our writers are their own and do not represent the views of U.Today. The financial and market information provided on U.Today is intended for informational purposes only. U.Today is not liable for any financial losses incurred while trading cryptocurrencies. Conduct your own research by contacting financial experts before making any investment decisions. We believe that all content is accurate as of the date of publication, but certain offers mentioned may no longer be available.
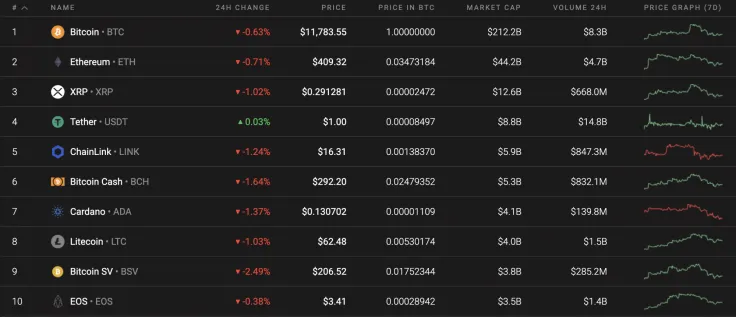
A more profound cryptocurrency market correction might have started as all coins from the top 10 list are in the red. Bitcoin SV (BSV) is the biggest loser, having declined by 2.50% since yesterday.
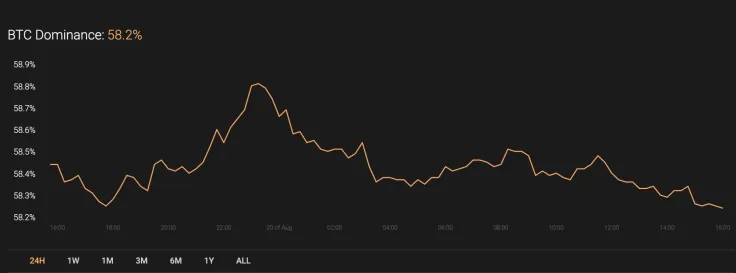
Meanwhile, Bitcoin's (BTC) dominance keeps decreasing, currently sitting at 52.2%.
The Bitcoin data is looking the following way:
-
Name: Bitcoin
Advertisement -
Ticker: BTC
-
Market Cap: $218 074 055 039
-
Price: $11 809,52
Advertisement -
Volume (24h): $22 174 359 787
-
Change (24h): -0.95%
The data is relevant at the press time.
BTC/USD: Сan One Expect Another Rise Attempt to $12,000?
Yesterday the point of control (POC) line ($11,760) prevented the Bitcoin (BTC) price from declining further. At the end of the day, the pair set a local minimum at $11,574 and then bounced back to the POC level of $11,760 to continue moving sideways.
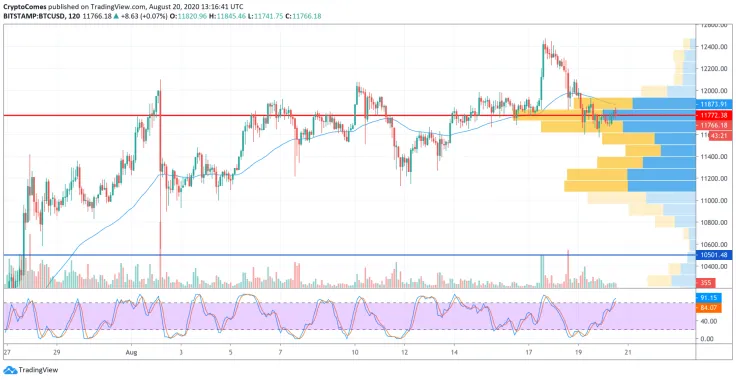
During the night, trading volumes significantly decreased, and the range of consolidation is now narrowing. Today, buyers might try to test the two-hour EMA55 and reach consolidation above the average price level. If they don't overcome the resistance of the moving average (EMA55), then the decline will continue to the fifty percent Fibonacci level ($11,394).
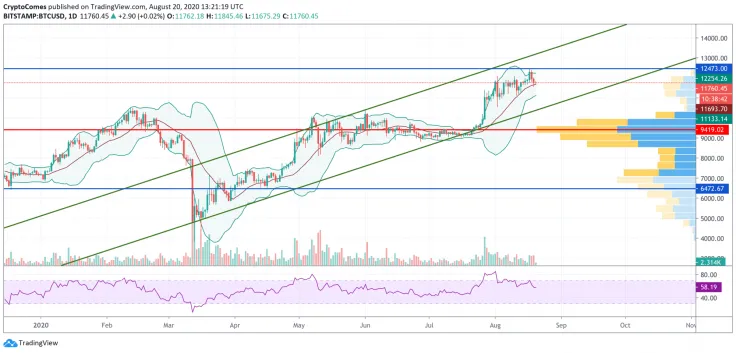
On the daily chart, Bitcoin (BTC) quotes are being adjusted again. The price is still above the middle line of the Bollinger Bands indicator, which signals the presence of bulls. An important support area is located at the level of $10,535. Already with the test of this level, one can consider a rebound from the support line on the RSI indicator to be a plausible scenario.
The scenario will be invalidated in case of a breakdown of the lower trendline of the ascending channel with the price fixing below the $9,810 level. In this case, one should expect a drop to $7,870 and the beginning of the next correction.
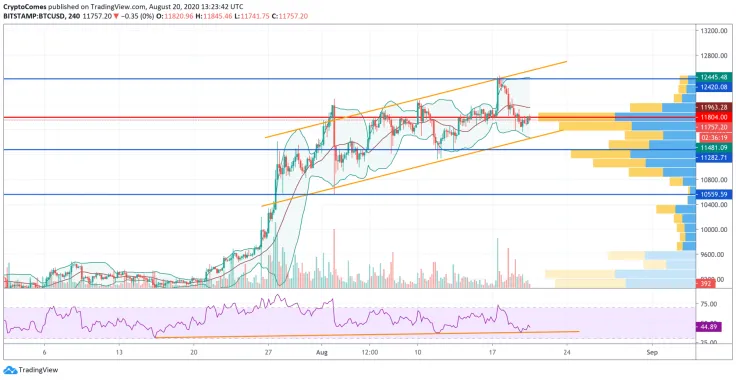
On the four-hour chart, the price bounced off the upper trendline of the ascending channel. Bitcoin has strong support at the $11,225 level, after which one should expect a new attempt to push the BTC price to the level of $12,495. Here is the proximity of the support line on the RSI indicator, a rebound from this line might be a good signal for continued growth. The invalidation of the scenario will be a breakdown of the lower trendline of the ascending channel with the price fixing below the level of $11,150, in this case, a fall to the level of $10,540 is expected.
Bitcoin is trading at $11,764 at press time.
 Vladislav Sopov
 Dan Burgin