
Disclaimer: The opinions expressed by our writers are their own and do not represent the views of U.Today. The financial and market information provided on U.Today is intended for informational purposes only. U.Today is not liable for any financial losses incurred while trading cryptocurrencies. Conduct your own research by contacting financial experts before making any investment decisions. We believe that all content is accurate as of the date of publication, but certain offers mentioned may no longer be available.
Ripple is one of the most affected assets after today's market fall. Its rate has declined by more than 7% over the last 24 hours. Against the background of it, the market capitalization has lost around $1 billion, while the trading volume has increased by approximately $400 million.
There could be 2 reasons for such a decline. The first one is the most vivid: XRP’s fall has been accompanied by the decline of the whole cryptocurrency market.
The second is less noticeable: Ripple's CTO, David Schwartz, announced selling off all his coins, which could probably affect the price change.
Now, let’s analyze the technical part.
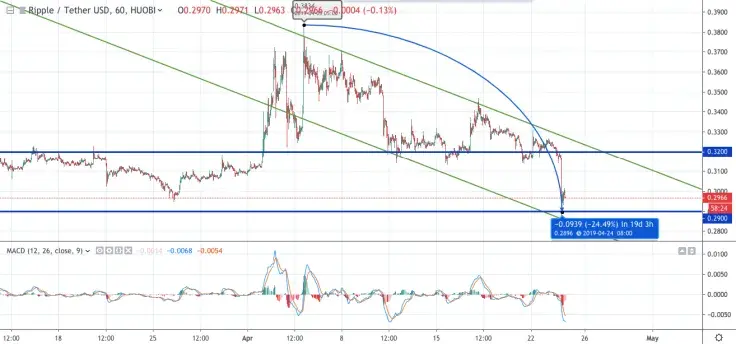
On the 1-hour chart, a strong resistance zone at $0.2900 was broken, however, later the price bounced back to $0.3000, where the quotes are trading now. From the start of April, we see that XRP is moving in the descending channel, having lost around 25%.
At the moment, there are no signals that could influence the trend change. The MACD indicator also shows bearish tendencies.

Now, let’s get into another chart.
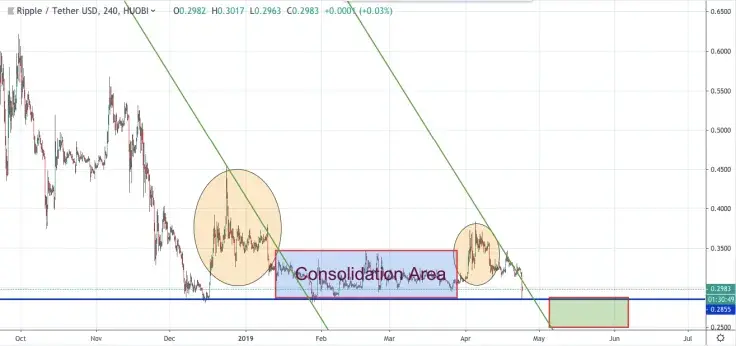
On the 4-hour chart, we see a pattern is being formed similar to the one that appeared from the end of December to the start of January. After that, a consolidation occurred, and the price was trading sideways. If we apply that situation to the current quotes, XRP should be in the green zone the next few weeks.
As we wrote before, Ripple is following neither bullish nor bearish market tendencies, and it has its own way of changing price.
 Dan Burgin
 U.Today Editorial Team