Disclaimer: The opinions expressed by our writers are their own and do not represent the views of U.Today. The financial and market information provided on U.Today is intended for informational purposes only. U.Today is not liable for any financial losses incurred while trading cryptocurrencies. Conduct your own research by contacting financial experts before making any investment decisions. We believe that all content is accurate as of the date of publication, but certain offers mentioned may no longer be available.
Ripple stays around the $0.24 level even despite the fact that altcoin market has survived through a short downtrend. XRP never gives up and continues resisting the bear traps on the way to its higher highs. How much XRP will cost in the nearest days, and is it possible to overcome the $0.27 level shortly? Read XRP price predictions from TradingView users.
Wait for XRP history repetition
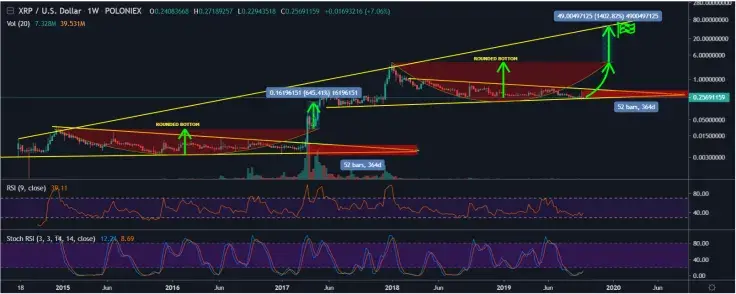
The theory of Leb-Crypto is that there is a possibility that a repeat of the previous macro rounded bottom is happening right now. XRP technically is on the verge of massive upside; it is imminent, especially as BTC trends sideways and even downwards in a coming couple of months.
A rounded bottom has a very clear target if and when it plays out; as you can see by the previous one in 2017. Yet the 2017 bull run was so powerful that it is even over-shot that target after a few months of consolidation.
Will history repeat and we hit the current rounded bottom target at around $50 EOY?
Honestly, this is a very high target, but Ripple is a very peculiar coin, and it can show crazy performance in Q4 2019. User Leb-Crypto sticks to $12 EOY target as a "conservative”.
Climb back to $0,27 is possible?
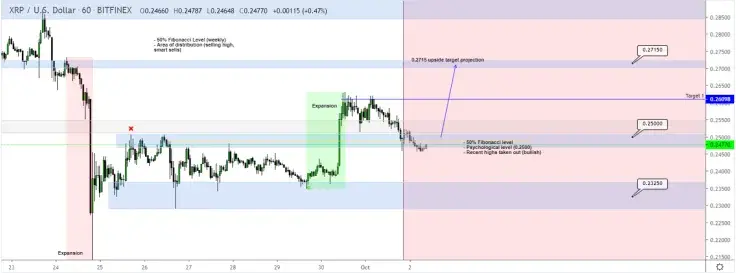
User miguelmxlo claims that Ripple can reach $0.27 again in the following day. His XRP Thesis is based on the following technical indicators:
-
Weekly: Last weeks’ candle closed as a bearish engulfing closing below $0.2500 major weekly zone taking out previous weekly lows. XRP could move a lot lower.
-
Daily: After a new low was formed at $0.2325 Monday candle closed as a bullish engulfing and broke above 0.2500 major level signaling a recovery back up to 0.2715 is on the cards.
-
1hr: Now expect a pullback into $0.2500 after the break before seeing a possible rally up to $0.2715 forming a new bullish leg.
XRP waves a bullish flag
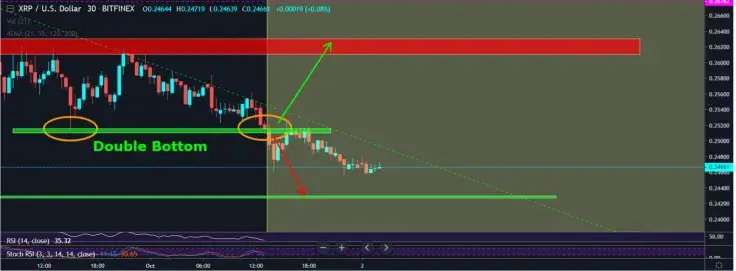
So, what’s going on with Ripple? Is it a double bottom and pump or simply just dump?
Before you start trading, RSibayan warns you: remember to always, always place your stop loss at the appropriate levels immediately after you have put in your long/short position so as not to get stopped out at your trades. Always be prepared for either scenario of upwards movement, downwards movement, or sometimes even sideways movement (consolidation phase & sometimes even extended consolidation phases.
If we observer Ripple’s movements during the last day, we can note that Double Bottom didn't happen, but it's now headed to the bottom. Will this rebound from the 0.618 or continue down to the 0.786 level?
If it looks like an XRP Bull Flag, feels like an XRP Bull Flag, and the fractals tell the same story, then expect an eventual pump.

Consolidation to $0.27
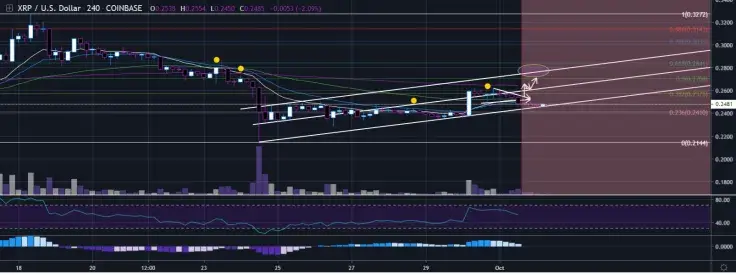
XRP has been consolidating bullishly after breaking out of the weekend triangle. If we reset the charts we can see a rising channel with a potential target area of just under $0.28 if this Bull pendant/flag plays out and pushes up.
What do price charts tell us?
-
On a 15 minute chart, the trader has noticed a possible pendant formation with breakout moves mapped out.
-
On 1H chart, the rising channel for XRP currently is forming a possible bullish pendant.
-
4H chat zoomed in downsloping consolidation over moving averages after a major move up.
-
On 1D chart, the rising channel met with resistance at the 13 and 21 EMAs. Upper targets are at the 0.5 and 0.618 fib levels.
After breaking the pendant formation support line, price revisited as resistance and returned to the low. Volume is coming down on this recent decline and could be coming to an area to pivot from.
 U.Today Editorial Team
 Dan Burgin