
After a sharp fall, the cryptocurrency market could not start a bullish trend and keeps trading at its previous levels. Most of the top 10 coins are facing a slight decline, except for Bitcoin Cash, whose rate increased by 1.76% over the last day. If a few days ago Cardano was the top gainer, today, it is the biggest loser, going down by 3.51% over the past 24 hours.
Top 10 coins
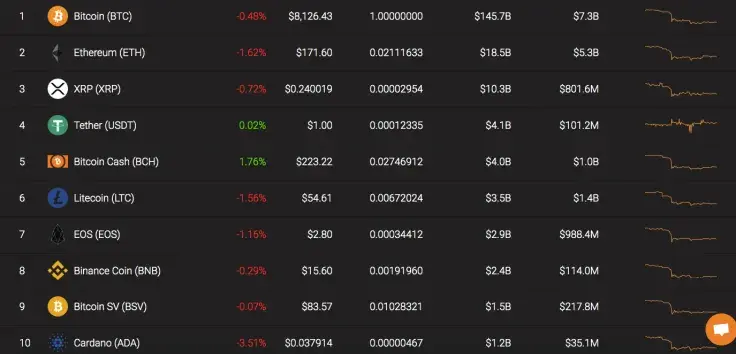
The key indicators of the top 3 coins are looking the net way.
|
Name |
Ticker Advertisement
|
Market Cap |
Price |
Volume (24h) Advertisement
|
Change (24h) |
|
Bitcoin |
BTC |
$147 628 851 225 |
$8 218,26 |
$14 015 048 144 |
-0,48% |
|
Ethereum |
ETH |
$18 721 445 868 |
$173,45 |
$6 810 097 293 |
-1,62% |
|
XRP |
XRP |
$10 444 774 117 |
$0,242451 |
$934 764 309 |
-0,72% |
BTC/USD
The leading cryptocurrency keeps locating in a sideways trend, trading between $8,000 and $8,400.
BTC/USD 4-hour chart
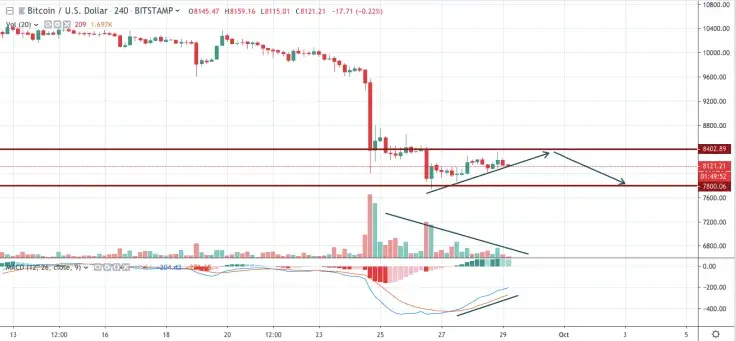
On the 4H chart, the MACD indicator is moving upward, suggesting a short-term price rise. In this case, BTC is likely to reach $8,400 soon. However, the long-term perspective remains bearish due to the decreasing trading volume. Respectively, Bitcoin might go down after testing $8,400. The nearest mark will be the level of $7,800.
Bitcoin is trading at $8,121 at press time.
ETH/USD
Ethereum is moving according to our recent prediction, as the bounceback from the levels of $166 happened.
ETH/USD 4-hour chart
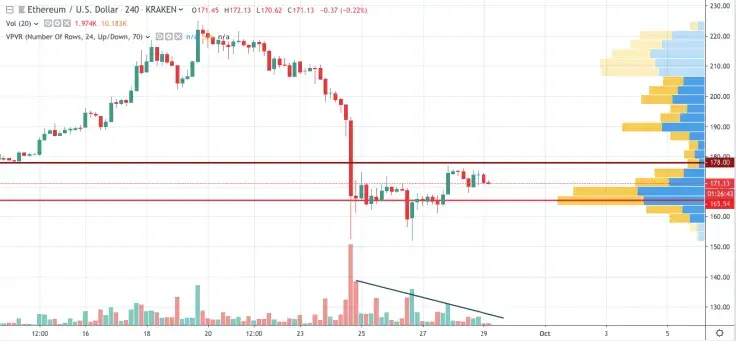
Ethereum is trading below the $178 mark, confirming the dominance of sellers on the market. The current level of trading volume also confirms the ongoing decline. One may think about a potential reversal only if ETH fixes above $178. In other cases, there are high chances to go below $165.
Ethereum is trading at $171.13 at press time.
XRP/USD
XRP has shown the least drop compared to other top coins. Its rate has gone down by less than 1% over the last day.
XRP/USD 1-day chart
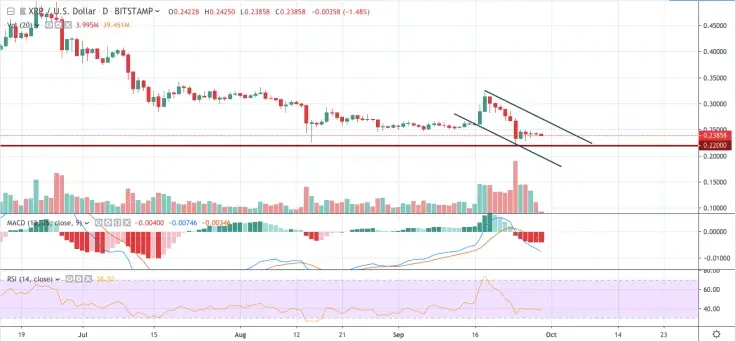
On the 1D chart, XRP has been located in a bearish wave since September 19 with no signals for a possible rise. The RSI indicator has not touched the bottom yet, confirming the decline, as well as, MACD that also supports the bearish tendencies. In this regard, the coin is likely to achieve $0.22 soon.
XRP is trading at $0.2389 at press time.
 Dan Burgin
 U.Today Editorial Team