Disclaimer: The opinions expressed by our writers are their own and do not represent the views of U.Today. The financial and market information provided on U.Today is intended for informational purposes only. U.Today is not liable for any financial losses incurred while trading cryptocurrencies. Conduct your own research by contacting financial experts before making any investment decisions. We believe that all content is accurate as of the date of publication, but certain offers mentioned may no longer be available.
The last day of the week is about end on a bearish note. Yet, the top coins are trying to bounce back. Bitcoin SV (BSV) has suffered the most since yesterday's drop, as the rate for the altcoin lost 6.32%.
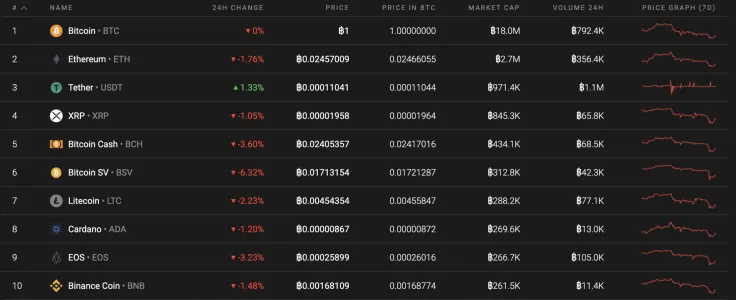
Below is the vital information on Bitcoin (BTC), Ethereum (ETH), and XRP:
|
Name |
Ticker Advertisement
|
Market Cap |
Price |
Volume (24H) Advertisement
|
Change (24H) |
|
Bitcoin |
BTC |
$166,788,323,026 |
$9,056.22 |
$16,713,559,699 |
0.01% |
|
Ethereum |
ETH |
$24,959,565,363 |
$223.78 |
$7,277,625,925 |
-1.75% |
|
XRP |
XRP |
$7,914,955,821 |
$0.178838 |
$1,261,500,844 |
-0.99% |
BTC/USD
Bitcoin (BTC) continues to consolidate in the $9,000-$10,00 range despite yesterday's drop to $8,900. The rate is unlikely to go below $9,000 as the level of trading volume is low.
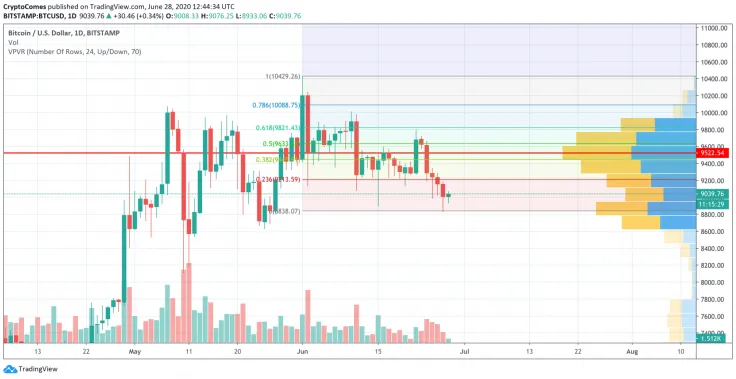
Looking at the daily time frame, the leading crypto has made the far rates of the $9,000 mark. Applying the Fibonacci retracement to the chart from its local peak to bottom, Bitcoin (BTC) is about to return to the 38.2% level, which corresponds to the $9,445 mark. Here, liquidity level is quite high, which a prerequisite for an upward movement.
At press time, Bitcoin was trading at $9,045.
ETH/USD
Ethereum (ETH) has dropped more than Bitcoin (BTC); however, it might still come back to its resistance levels. The rate of the main altcoin has declined by 3.16% from the previous week.
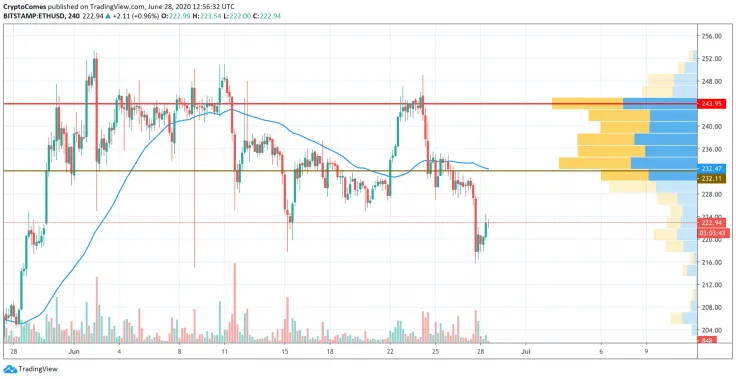
The trading volume was low during yesterday's decline. This means that the bears are unlikely to move towards $210 and below. The bulls are currently trying to return to their previous levels around the $230 mark. The more likely price action for Ethereum (ETH) may be a retest of the 50-Day Moving Average ($232). If buyers manage to break the mark, then one might consider a growth continuation towards $250 in July.
At press time, Ethereum was trading at $222.85.
XRP/USD
XRP has shown significantly better price dynamics than Ethereum (ETH). The price of the coin has dropped by 0.81% as compared to the previous 24 hours.
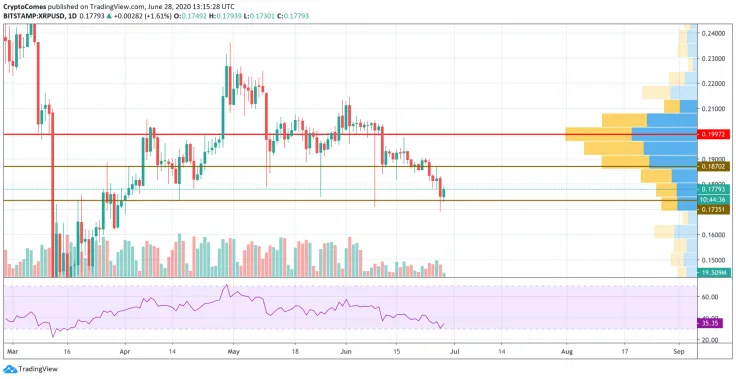
XRP found its local bottom at $0.1730, followed by a bounce off. As with the case of Ethereum (ETH), a continuing decline is unlikely to occur as the bears have run out of fuel. This is based on the trading volume. However, there is a reason for a growth continuation as there is a bullish divergence on the Relative Strength Index (RSI). Respectively, the growth might near its resistance level at $0.1870.
At press time, XRP was trading at $0.1778.
 Dan Burgin
 U.Today Editorial Team