Disclaimer: The opinions expressed by our writers are their own and do not represent the views of U.Today. The financial and market information provided on U.Today is intended for informational purposes only. U.Today is not liable for any financial losses incurred while trading cryptocurrencies. Conduct your own research by contacting financial experts before making any investment decisions. We believe that all content is accurate as of the date of publication, but certain offers mentioned may no longer be available.
The XRP price chart is delivering a worrying signal. The volume, which tells us how much XRP is being traded, is going down rapidly, while the price of the asset is ascending. Unfortunately, it is one of the worst signs for an asset in an uptrend.
High trading volume usually means a lot of people are interested in a cryptocurrency. It can make the price move up or down more strongly. Low volume implicates that not as many people are willing to trade.
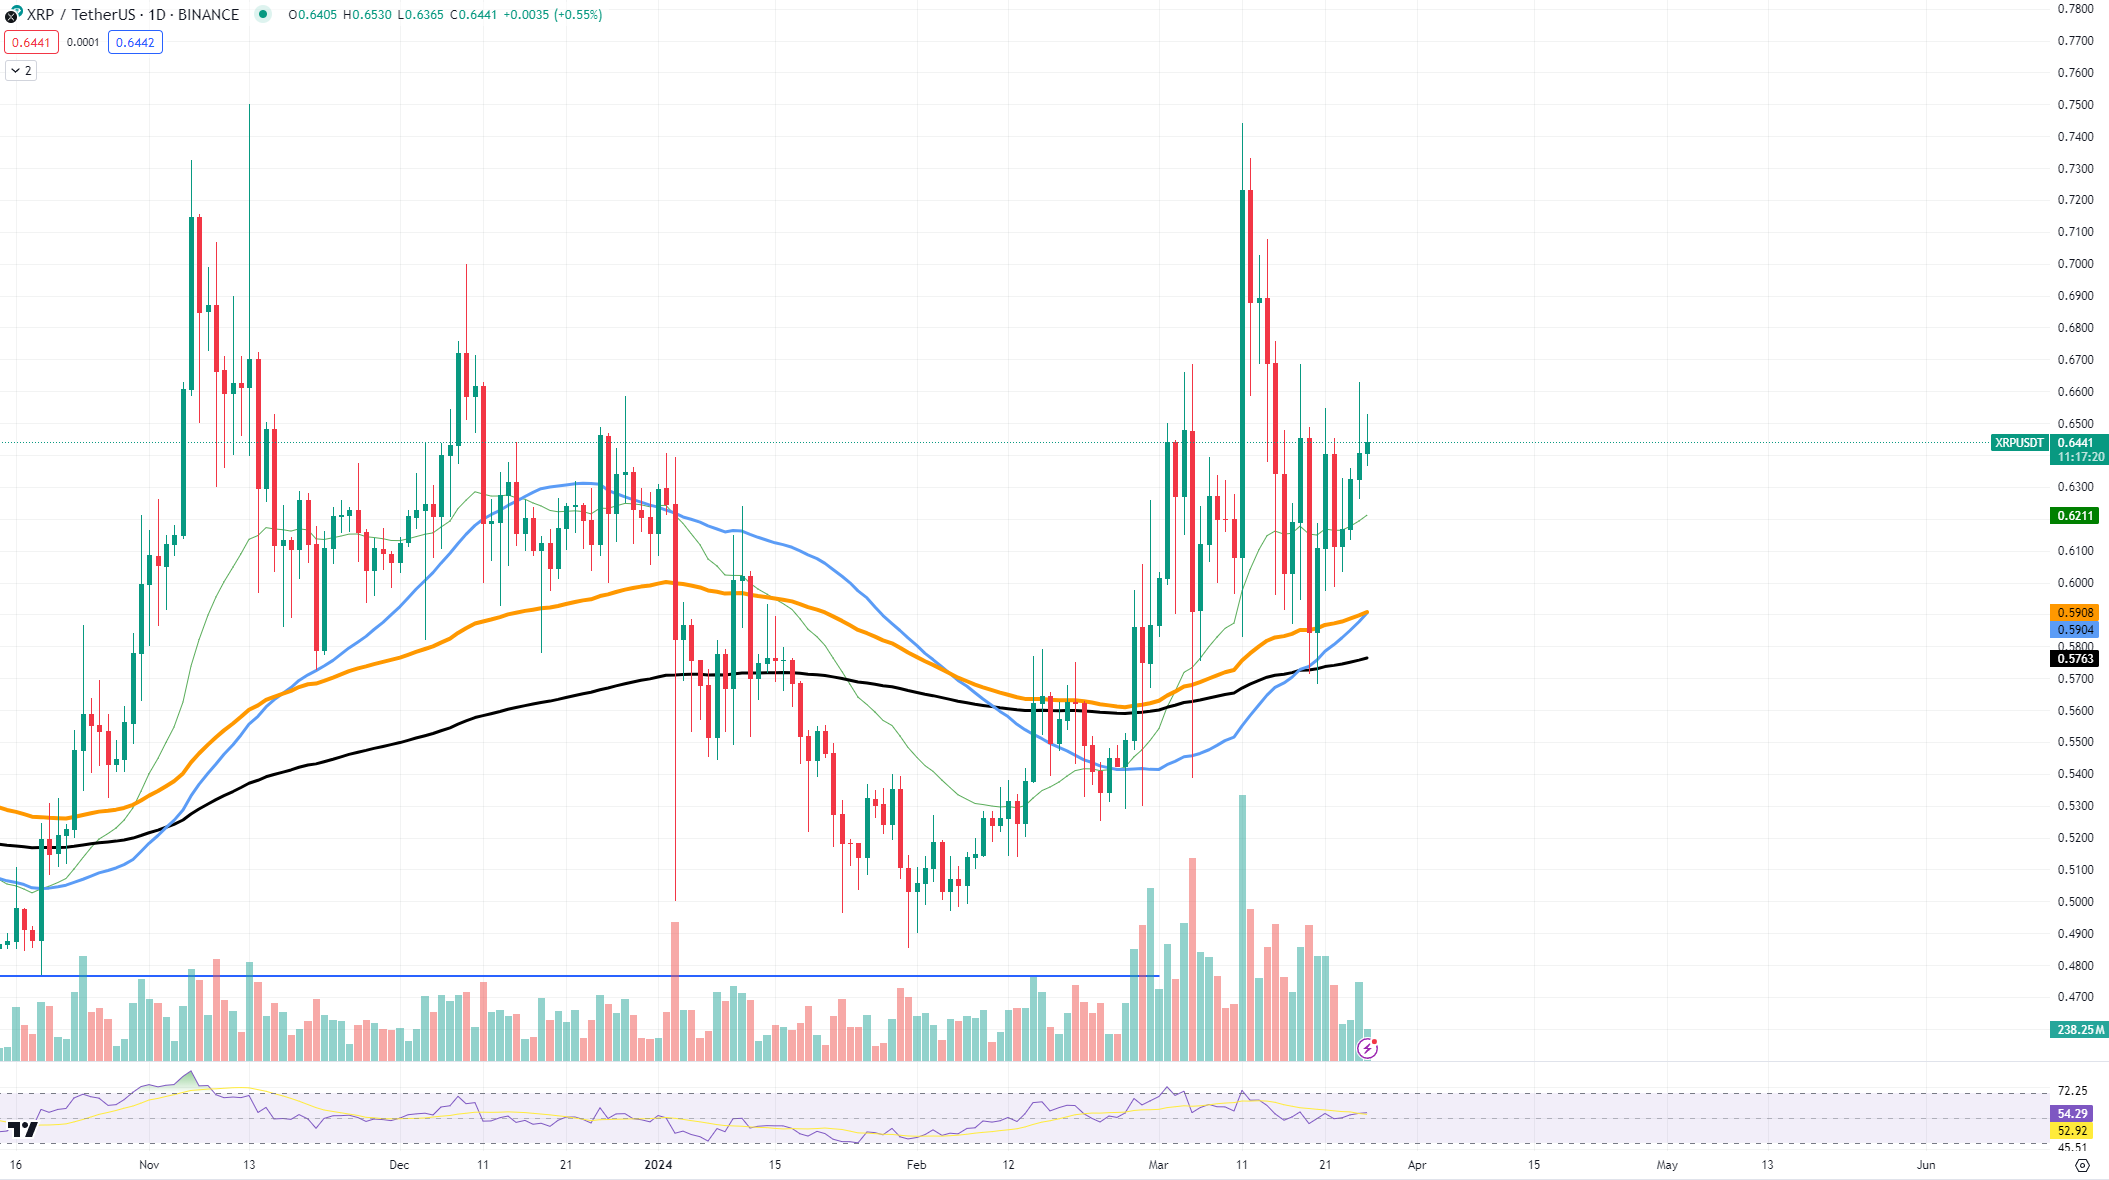
On the chart, we see that even though the price of XRP is trying to move up, the falling volume could make this harder. Without enough momentum, XRP's uptrend will quickly end.
Right now, XRP has a support level at $0.5997. But if the price drops below this net, it could fall to the next one at $0.5218.
For XRP, the first ceiling is at $0.68. If the price can break through that, it might try for the higher ceiling at $0.78. The breakthrough of the aforementioned resistance level will most likely lead to a rally acceleration and a further continuation.
Cardano goes up
Cardano's price has pushed above a line that it could not get past before, which could mean it is ready to fly.
Let's break it down. On the chart, ADA has climbed above what iss known as the 21-day Exponential Moving Average (EMA). This line helps us see the trend by averaging out the price changes over the last 21 days. ADA's price is now at $0.6578, which is above the critical threshold, and it is a hint that the price could be getting ready to go on a bit of a run.
For ADA, there is a support level at $0.5994. If the price starts to fall, this level could help stop it from falling further. However, even in case of a correction, ADA has proven to be resilient enough to avoid major sell-offs.
ADA has a resistance level at $0.6793. If the price can reach past this level, the next big step is at $0.7251, and getting there could mean the price is on a real upward path.
So, what does the future look like for ADA? Well, with this breakout, it is looking pretty bright. ADA has found a new energy, and if more people start providing inflows to the asset, we will see a substantial price appreciation. But remember, the crypto market is full of surprises, and prices can go down just as fast as they go up.
Shiba Inu's surge
Shiba Inu is clearly painting a "cup reversal" pattern. This is good news for SHIB fans because it is a pattern that suggests prices could be getting ready to rise.
A cup reversal pattern is like watching a tea cup form from the side. First, prices drop down, forming the left side of the cup. Then, instead of bouncing right back up, they stay low for a while, making the bottom of the cup. This is where things get steady, and it is important because it shows that the price is not falling anymore. Finally, the prices start to climb up again, forming the right side of the cup.
On the SHIB chart, we can see the prices forming this pattern. After a big jump, the prices came down and have started to level out. This leveling shows us that SHIB is building a strong base around the 0.00001380 mark, which is acting as support.
As the right side of the cup forms, we want to see SHIB climb past certain levels that act as resistance. Resistance is like a ceiling that prices need to break through to keep going up. On the chart, the first big resistance level to watch is at the 0.00002800 price. If SHIB can break past that, the next target could be the recent high around 0.00003400.