Disclaimer: The opinions expressed by our writers are their own and do not represent the views of U.Today. The financial and market information provided on U.Today is intended for informational purposes only. U.Today is not liable for any financial losses incurred while trading cryptocurrencies. Conduct your own research by contacting financial experts before making any investment decisions. We believe that all content is accurate as of the date of publication, but certain offers mentioned may no longer be available.
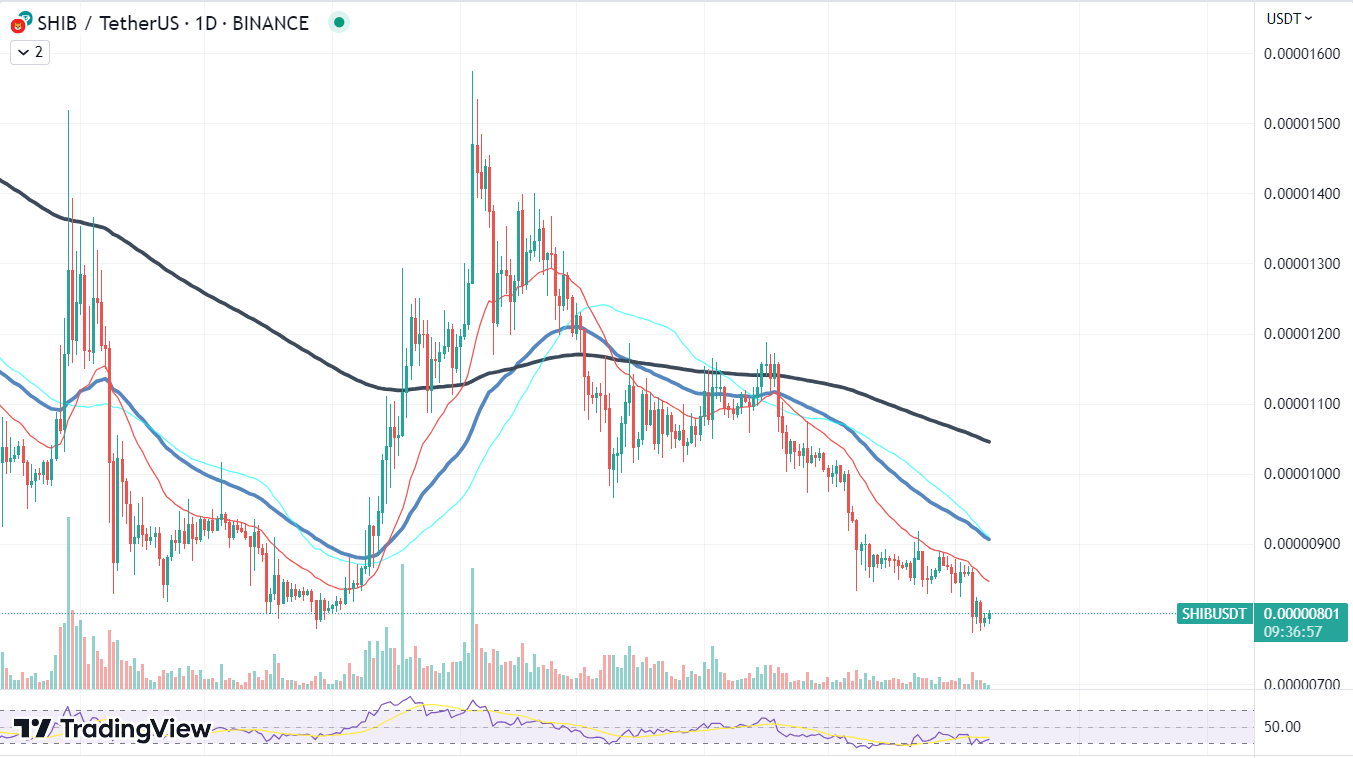
Shiba Inu (SHIB) has clawed its way back to a price level of $0.000008. While this recovery might bring some sighs of relief to its investors, the meme coin still has a lot to prove if it is to regain the status of an attractive investment.
According to data from IntoTheBlock, a whopping 86% of SHIB investors are currently "underwater," meaning they are in a losing position with their investments. This harsh reality underscores the volatility and risk associated with investing in meme coins like SHIB, which can witness massive price swings due to market sentiment and hype.
Meanwhile, a mere 11% of SHIB investors are in profit, indicating that they bought the token at a lower price point and are presently experiencing gains. It is likely that these are early adopters who bought in near the coin's inception and have held onto their tokens through the market's turbulent ups and downs.
The current price of SHIB at $0.000008 seems to have formed a solid support level, thanks in part to these long-term holders who remain unlikely to sell their holdings at this point. This resistance to selling could provide some price stability for SHIB and may prevent further significant drops.
Nevertheless, for Shiba Inu to become a more appealing prospect for potential investors, it needs to show more than just resilience at its current price. It requires signs of sustained growth, broader acceptance and use cases beyond speculative trading. Also, reducing the high percentage of investors currently at a loss would undoubtedly bolster confidence and attract new investment.
Bitcoin poised for breakout
Bitcoin is demonstrating strong bullish signals that could presage a significant price breakout. As of recent technical analysis, Bitcoin is trending within an ascending price channel and showing signs of developing a bullish flag pattern, a powerful indicator of potential upward momentum.
This development is significant as a bullish flag pattern, characterized by a sharp price increase followed by a consolidating downtrend and a final sharp upward movement, which often predicts a continuation of a previous bullish trend.
Adding to this promising forecast is Bitcoin's current interaction with its 200-day moving average, a key technical level closely watched by traders. Bitcoin has recently made contact with this average, suggesting a potential foundation from which it could bounce higher.
Supporting this hypothesis, the trading volume of Bitcoin has seen upticks in recent periods. Volume often precedes price, with spikes in volume typically indicating strong investor interest and potentially serving as a precursor to substantial price movements.
Cardano hits bottom
Cardano (ADA), a top contender on the crypto market, is showing signs of potential turbulence, with its Relative Strength Index (RSI) hitting the lowest point seen in over three months. This low RSI value is a critical technical indicator used by traders to assess whether an asset is in an overbought or oversold condition. At present, Cardano's RSI signals that the asset is in an oversold state, which might be an indicator of an upcoming trend reversal or merely a continuation of the current downtrend.
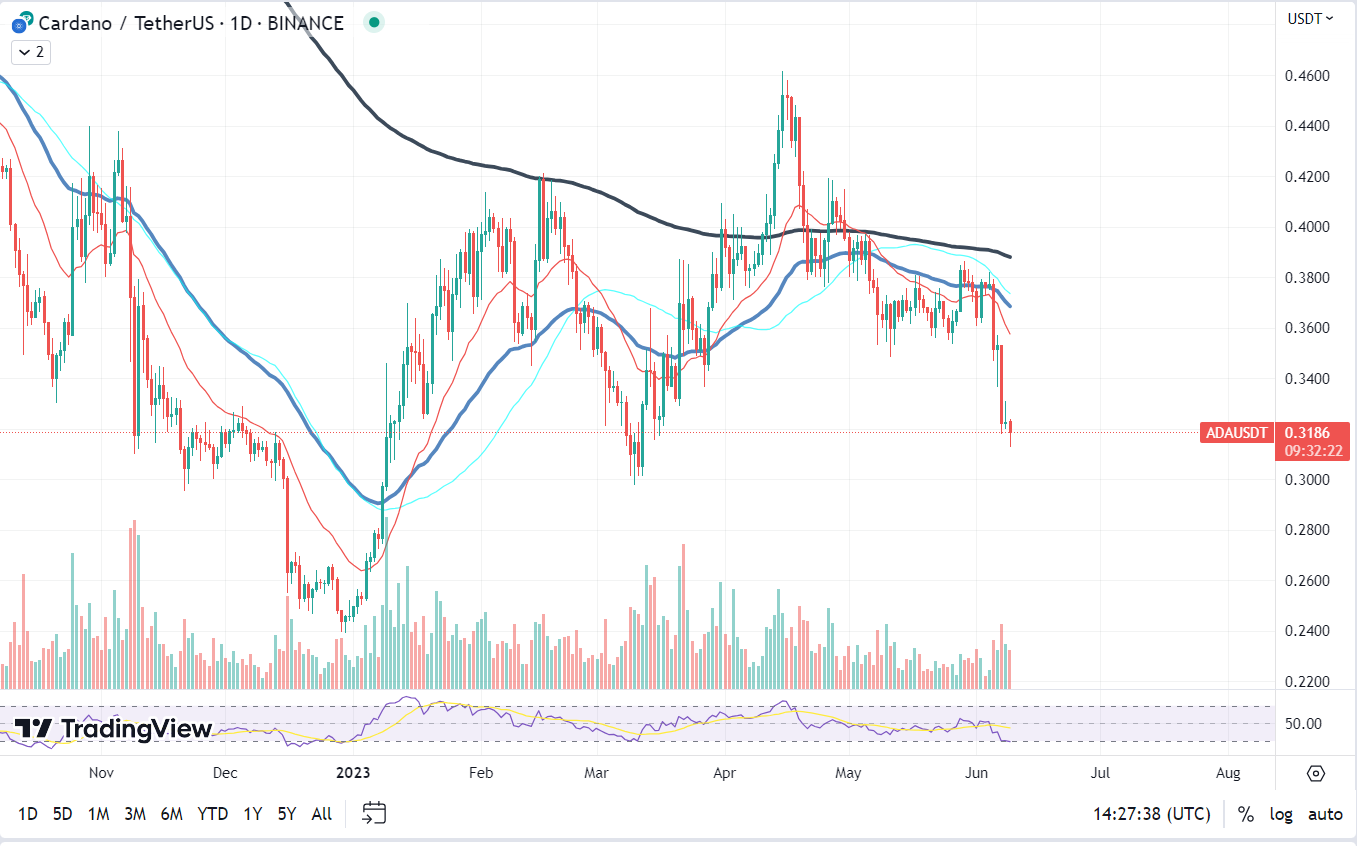
This drop in the RSI coincides with Cardano's price reaching its lowest level for the last three months. The price decline reflects the current market sentiment around Cardano, which seems to be in a bearish phase. However, this presents the possibility for an interesting investment opportunity as, historically, such bottom levels in the RSI have been followed by price recoveries.
Interestingly, despite the bleak market scenario, Cardano's trading volume is exhibiting an ascending dynamic. This increase in trading volume generally suggests heightened interest and activity on the market. However, the interpretation of this dynamic could go two ways.
On the one hand, the uptick in trading volume could indicate an upcoming price recovery. If the volume is being driven by new buyers entering the market, this could stimulate demand and push the price up, reversing the current downtrend.