The total cryptocurrency market cap has climbed from $103 billion (Friday, Dec. 7, 2018) to a high of $116 billion reached Sunday afternoon and has since shed $3 billion, standing at $113 billion at the time of writing.
Among all this, Ethereum is posting solid gains of about 20% over the weekend, breaking the $100 barrier, but has retracted lower since then, now trading at around $93.
Chart Analysis – ETH/USD

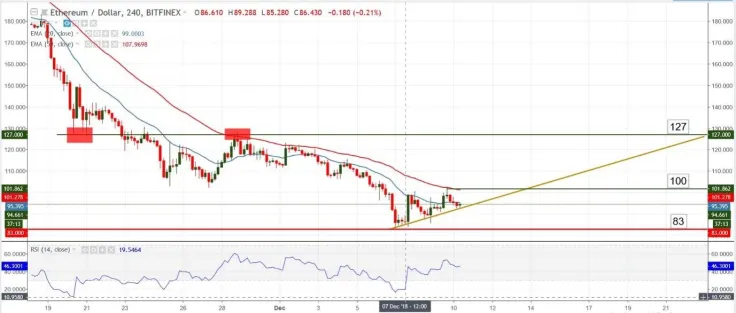
For the first time in a while, Ethereum is showing bullish pressure and the potential for a stronger push-up. However, keep in mind that currently the move up is a simple retracement in a strong downtrend and does not have any elements of a reversal.
The two Exponential Moving Averages (20 EMA and 50 EMA) are still crossed bearish and are well apart, showing there’s still enough bearish momentum, albeit their angle is flattening, which suggests the pair could be entering a ranging phase (sideways movement, no clear direction).
It must be also noted that ETH just pierced the $100 barrier, but the bulls weren’t able to sustain such a high price, and the pair quickly moved below that key handle, trading now at $93. All of this paints a blurry picture, and one can make an argument for both directions: up as a reversal or down as trend continuation.
The best conclusion right now is that we are dealing with a bullish retracement in a downtrend, which has the potential to turn into a full-scale reversal, but we will have to wait for additional clues before we can deem one scenario or the other to be true.
Support zone: bullish trend line followed by 83
Resistance zone: 100
Most likely scenario: break of the bullish trend line followed by choppy movement (we are in a downtrend, so we favor the short side)
Alternative scenario: break of 100 and bullish cross of the 2 EMAs
 Vladislav Sopov
 Dan Burgin