
EOS is going through hard times: the cryptocurrency has recently fallen in price, especially after the latest hack. The crypto community stays skeptic towards EOS price predictions, but experts from TradingView don’t lose hope, saying there’s a chance for uptrend.
How it could be otherwise with EOS being such a great blockchain? Statistics say it has all chances to retain its top positions:
RT Tronfoundation "RT RatingDapp: #DappWeekly #EOS continues to top at the weekly active users. However, there was a slight decrement whereas #TRON and #ETH steadily grew their user base.
— TronMacau(SR) (@MacauTron) 5 марта 2019 г.
?EOS: 127,647 (-3.04%)
?TRON: 94,807 (+4.34%)
?ETH: 35,770 (+… pic.twitter.com/e0vL6PIZNH"
Here’s what TradingView users think about EOS’ short-term price.
Keep calm and trade
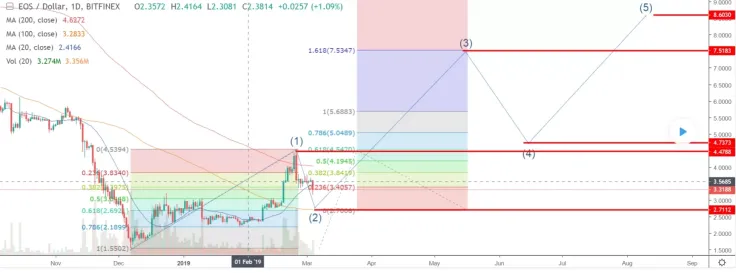
EOS price chart from Golden Dragon
The user called Golden Dragon suggested that we have the Elliott waves with Fibonacci retracement, which means the second wave is ending, and we’re approaching the third wave. The fifth wave should end with bullish movement and Fibonacci resistance of 61% and macro tendency.
Uptrend is possible
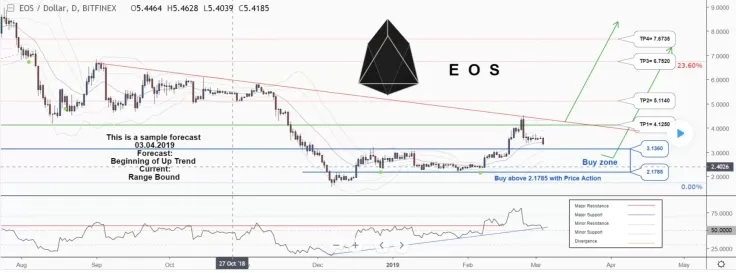
EOS price chart from ForecastCity
After analyzing the EOS/USD chart, ForecastCity concluded that the beginning of the uptrend is more than possible. The price is below the 21-Day WEMA, which signifies the dynamic resistance. RSI is at 51, which only proves this suggestion. However, if the price downtrend in the daily chart does not get broken, the bearish wave might go on and on.
All of that provides great trading opportunities. The beginning of the entry zone is $3.1360, and the ending of entry zone is $2.1785.
How do you know you approach a “Buy zone”? Look at when some of the reversal patterns are formed (“Bullish Engulfing”, “Hammer” or “Valley”). Do not enter trading when the price approaches reversal patterns but those are not formed.
If things go well, EOS might easily reach $5-7 by the end of March.
There might be something going
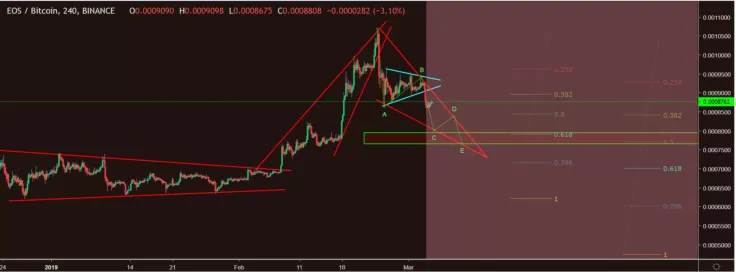
EOS price chart from Cryptosuf
The user Cryptosuf identified a symmetrical triangle pattern, which might mean there’s something going with EOS. We shouldn’t expect much trade in the long run, but with 1-2 more hits of the triangle, it may be a very exciting situation.
Potential Big Short Position
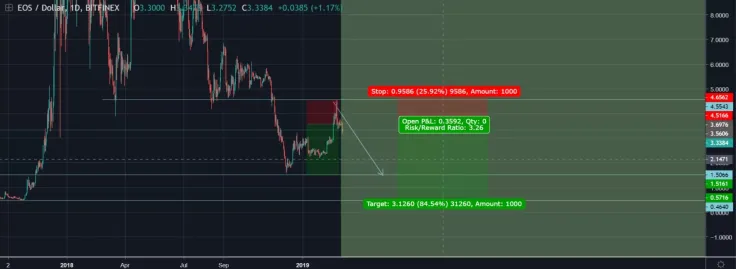
EOS price chart from PlaySafeWithUS
PlaySafeWithUS suggests that the support zone for EOS will be $1.506 with the last support zone around $0.46. The first big resistance is $4.55. In the following weeks, we are likely to test $the support zone if the $0.46 mark will be broken.
EOS/USD price chart from TradingView
Thus, EOS has to break the pattern to start growing. That might happen in the nearest time, even in March.
Disclaimer: The opinion expressed here is not investment advice – it is provided for informational purposes only. It does not necessarily reflect the opinion of U.Today. Every investment and all trading involves risk, so you should always perform your own research prior to making decisions. We do not recommend investing money you cannot afford to lose.
 Arman Shirinyan
 Alex Dovbnya
 Dan Burgin
 Denys Serhiichuk