
Disclaimer: The opinions expressed by our writers are their own and do not represent the views of U.Today. The financial and market information provided on U.Today is intended for informational purposes only. U.Today is not liable for any financial losses incurred while trading cryptocurrencies. Conduct your own research by contacting financial experts before making any investment decisions. We believe that all content is accurate as of the date of publication, but certain offers mentioned may no longer be available.
An approaching event on the technical charts is stirring up the sentiment around Dogecoin: the imminent cross of the 50-day and 100-day EMA. While EMA crosses are common technical events that can indicate trend shifts, they are not definitive price patterns and can sometimes lead to misinterpretations in the market.
Currently, Dogecoin is flirting with this potential EMA cross, which could introduce volatility into the market. If the 50-day EMA crosses below the 100-day EMA, traditionally known as a "death cross," it might be perceived as a bearish signal, potentially leading to an increase in selling pressure. Conversely, if the 50-day EMA crosses above the 100-day EMA, often referred to as a "golden cross," it could be seen as a bullish indicator.
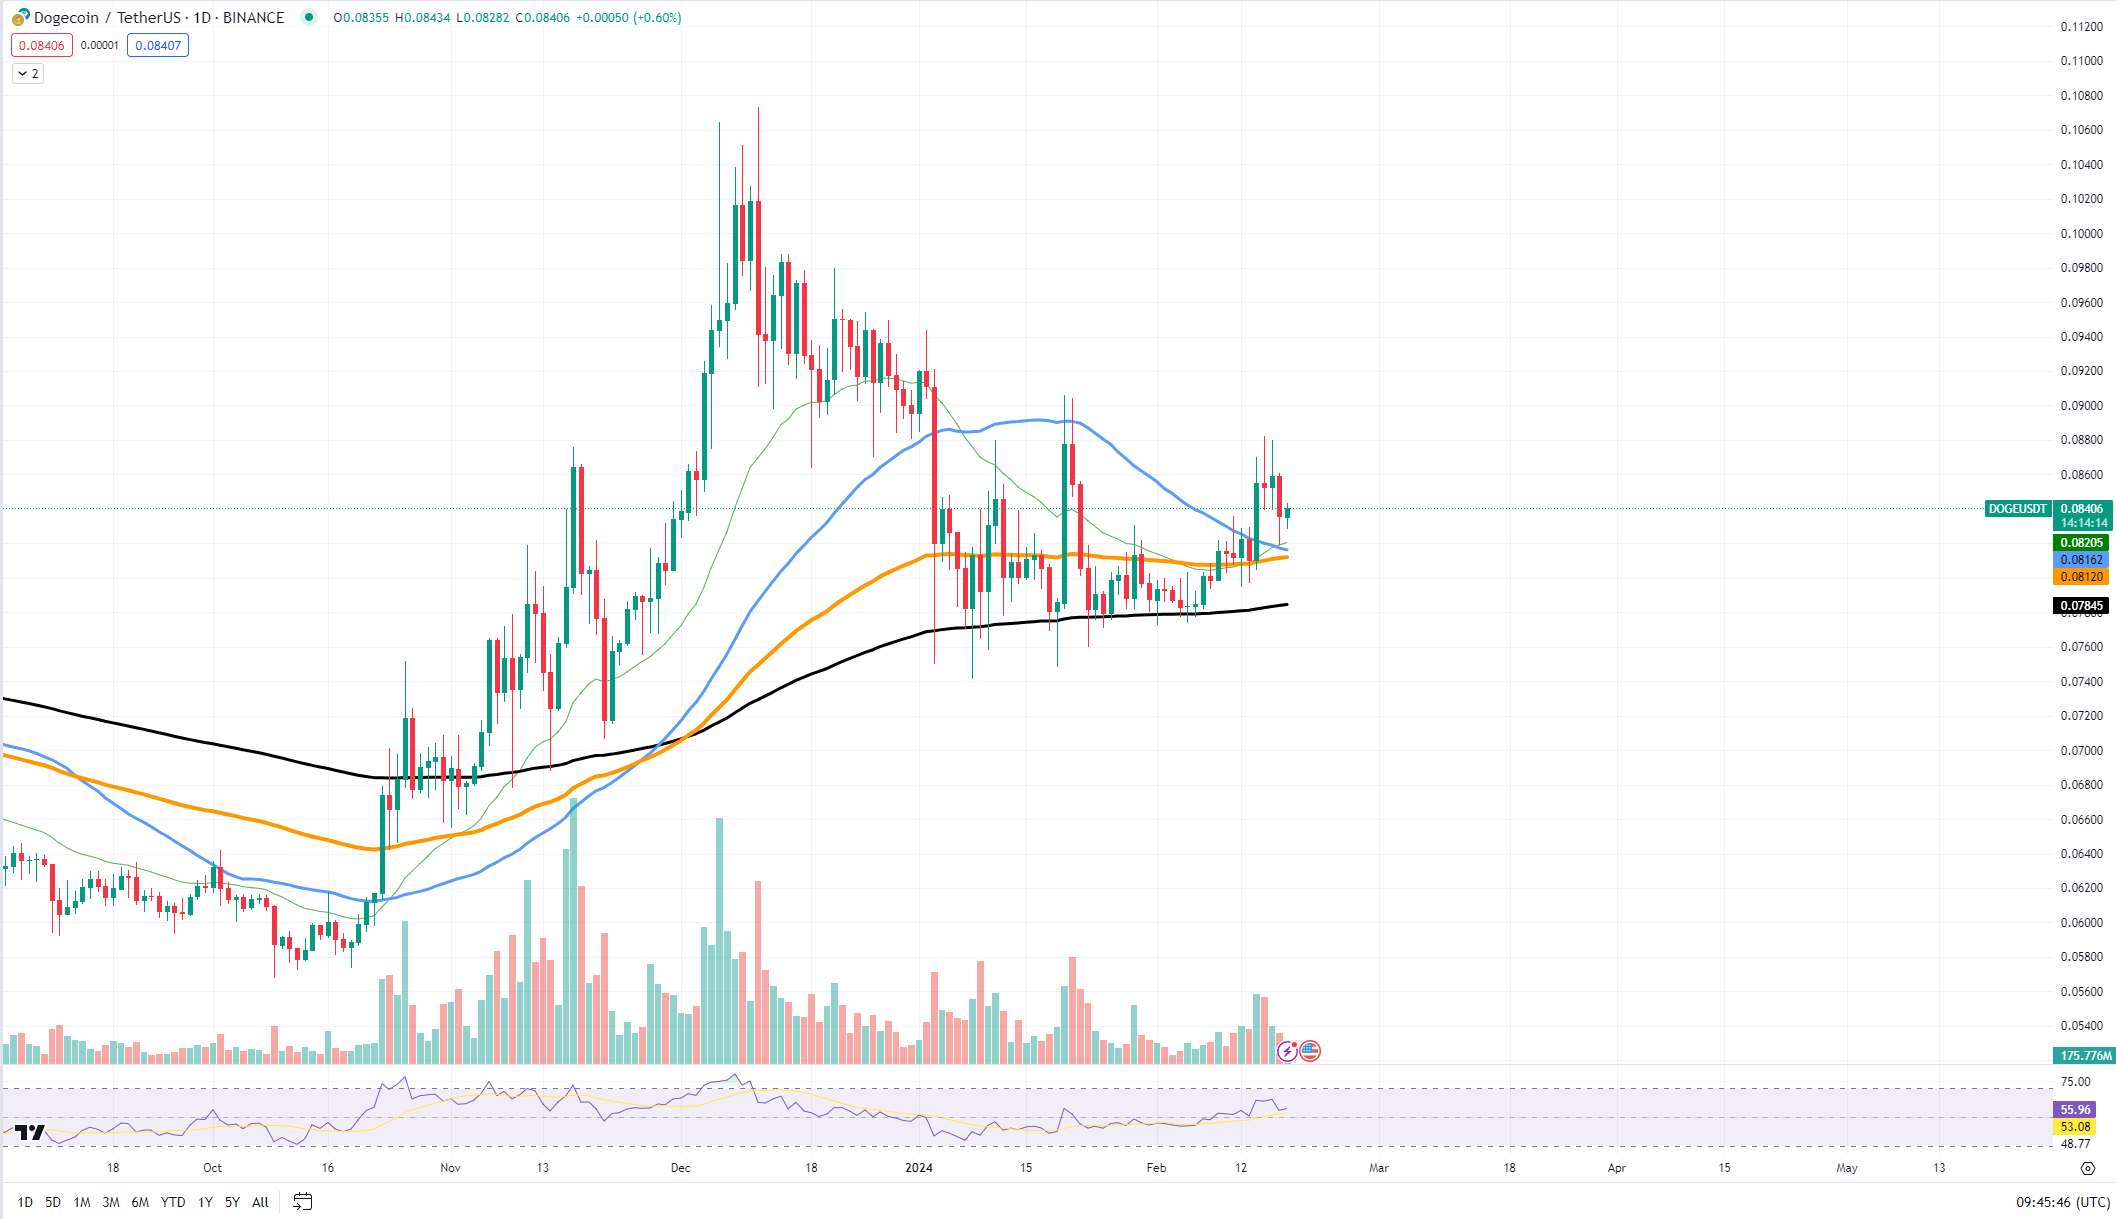
Looking at the price chart, Dogecoin is holding above the key support level at $0.080. This level has acted as a strong foundation in recent times, and a sustained hold above it is crucial for maintaining the current trend.
On the upside, resistance is found near $0.0845, where previous attempts to push higher have been rejected. A decisive break above this resistance could pave the way for further growth, potentially leading to a test of the $0.090 psychological barrier.
Cardano new local high is around
Cardano is edging closer to reclaiming its 2023 peak price levels. Currently, ADA is eyeing the $0.65 to $0.70 range, a zone that last year symbolized the pinnacle of its market value. Such an ascent not only boosts profitability for early investors but also enhances Cardano's allure as a promising asset within the crypto ecosystem.

The latest price movements of ADA reflect a robust momentum, with the token steadily climbing in value. The price action is decisively bullish, as it is now testing the resistance levels established in the previous year. A breakthrough above this range could signal a new era of confidence and growth for Cardano, potentially leading to an influx of investor interest and capital.
The growth drivers for ADA are multifaceted and may stem from the continuous development of decentralized finance (DeFi) solutions on the Cardano network, as well as a general uptick in market sentiment toward altcoins.
Solana's hidden potential
Solana is currently displaying intriguing chart patterns that suggest hidden potential for growth. An inspection of SOL's price movement against Ethereum reveals what appears to be an inverse double bottom pattern, a formation typically associated with bullish reversals. This pattern, often seen as a signal of the end of a downtrend and the start of an upward trajectory, indicates that Solana might be gearing up for a significant rally.

Despite the formation of a local double top, which some may interpret as a bearish signal, the broader interpretation of the chart suggests that this does not necessarily negate the bullish potential of the inverse double bottom. The double top may indeed introduce a level of resistance in the short term, but it does not outweigh the potential indicated by the double bottom.
Currently, Solana is trading near a critical juncture where the 50-day moving average converges with a notable support level. This support is crucial for maintaining the bullish outlook and is found around the 0.0038 ETH mark. Should Solana hold above this level, it would confirm the strength of the support and could act as a springboard for further gains.
On the resistance side, the level to watch closely is at the 0.0040 ETH mark, aligning with the peak of the recent double top. A breakout above this resistance could validate the inverse double bottom pattern and set the stage for a stronger upward movement. The next key resistance would likely be at the 0.0042 ETH level, where previous attempts to advance were thwarted.
 Dan Burgin
 U.Today Editorial Team