Disclaimer: The opinions expressed by our writers are their own and do not represent the views of U.Today. The financial and market information provided on U.Today is intended for informational purposes only. U.Today is not liable for any financial losses incurred while trading cryptocurrencies. Conduct your own research by contacting financial experts before making any investment decisions. We believe that all content is accurate as of the date of publication, but certain offers mentioned may no longer be available.
XRP is back below $3, but the bigger issue is not the round number itself; it is the technical structure behind the drop. Since it broke out in July, XRP has closed below the midline of the Bollinger Bands on the daily chart for the first time, showing that the momentum that had been building for weeks has changed. That mid-band, around $3.19, had been doing a great job of supporting the market through all the dips — until today.
When the price falls below the center of the bands, it no longer follows the trend; it starts looking for support. In this case, that support sits near the lower band on the daily time frame, currently hovering around $2.76 — another 6.24% down.

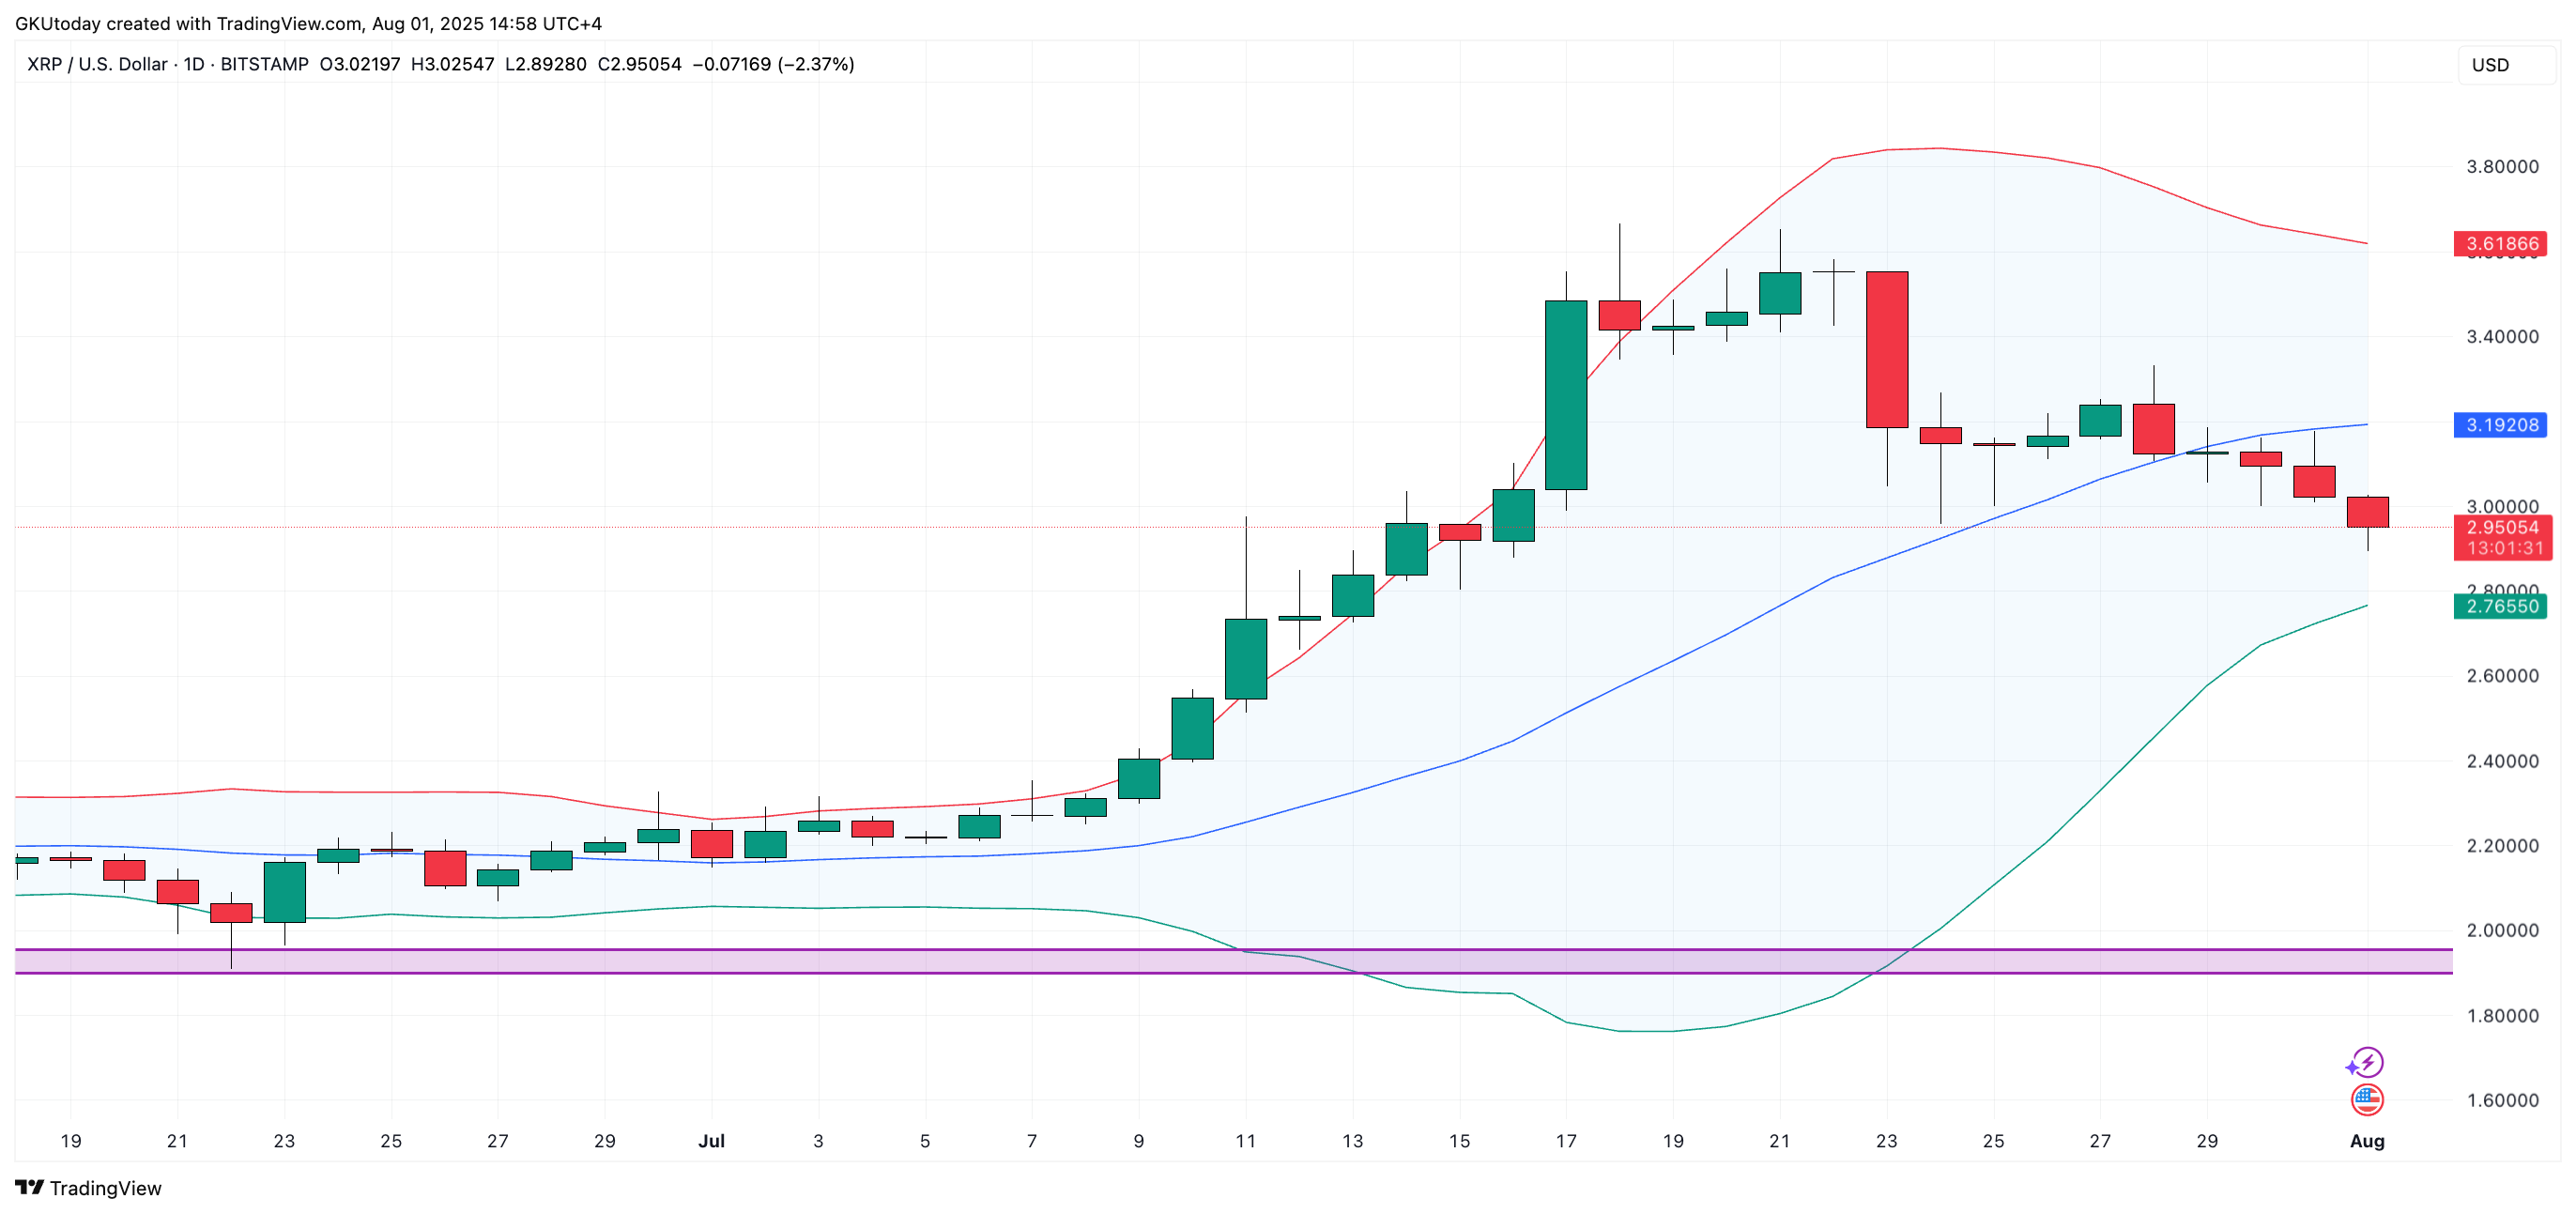
The bands, which had widened during the rally, are now narrowing again, which is a sign of cooling volatility and a likely precursor to a decisive move in either direction. With the midline gone, it looks like price will be testing that lower edge instead.
XRP on verge of 20% drop
At the same time, on the weekly chart, XRP is not in freefall, but the shape is starting to bend. The token is on track to close its second red candle in a row, and while it is still well above the long-term support zones, the weekly Bollinger Bands suggest there could be more drops to come.
XRP price has already slipped out of the upper band zone and looks increasingly likely to retest the weekly midline — currently around $2.39, another 20% down.

But that does not mean XRP is about to collapse. However, it is not as clearcut as it was just a week ago. Until it hits the 20-day average again, it is likely to go down, with both daily and weekly Bollinger setups showing that this cooling phase could go on longer than bulls would like.
 Dan Burgin
 U.Today Editorial Team