*** Please note the analysis below is not investment advice. The views and opinions expressed here are solely those of the author and do not necessarily reflect the views of U.Today. Every investment and trading move involves risk, you should conduct your own research when making a decision.
Bitcoin is on the edge
Bitcoin price slides on the triangle trendline. As you’ve seen on the four-chart, we don't have a candle close below the important trendline, the triangle trendline. Yesterday, the price touched exactly the round number area at $6,500 which worked nicely as a support, and it bounced quickly back to the triangle. This showed that buyers were alerted and they’ve caught this move pretty quickly and managed to push the price back above the trendline. After that, we have small green candles, but those small green candles are slowly climbing above the EMA's. We still have a golden cross between the 50 and 100 EMA's.
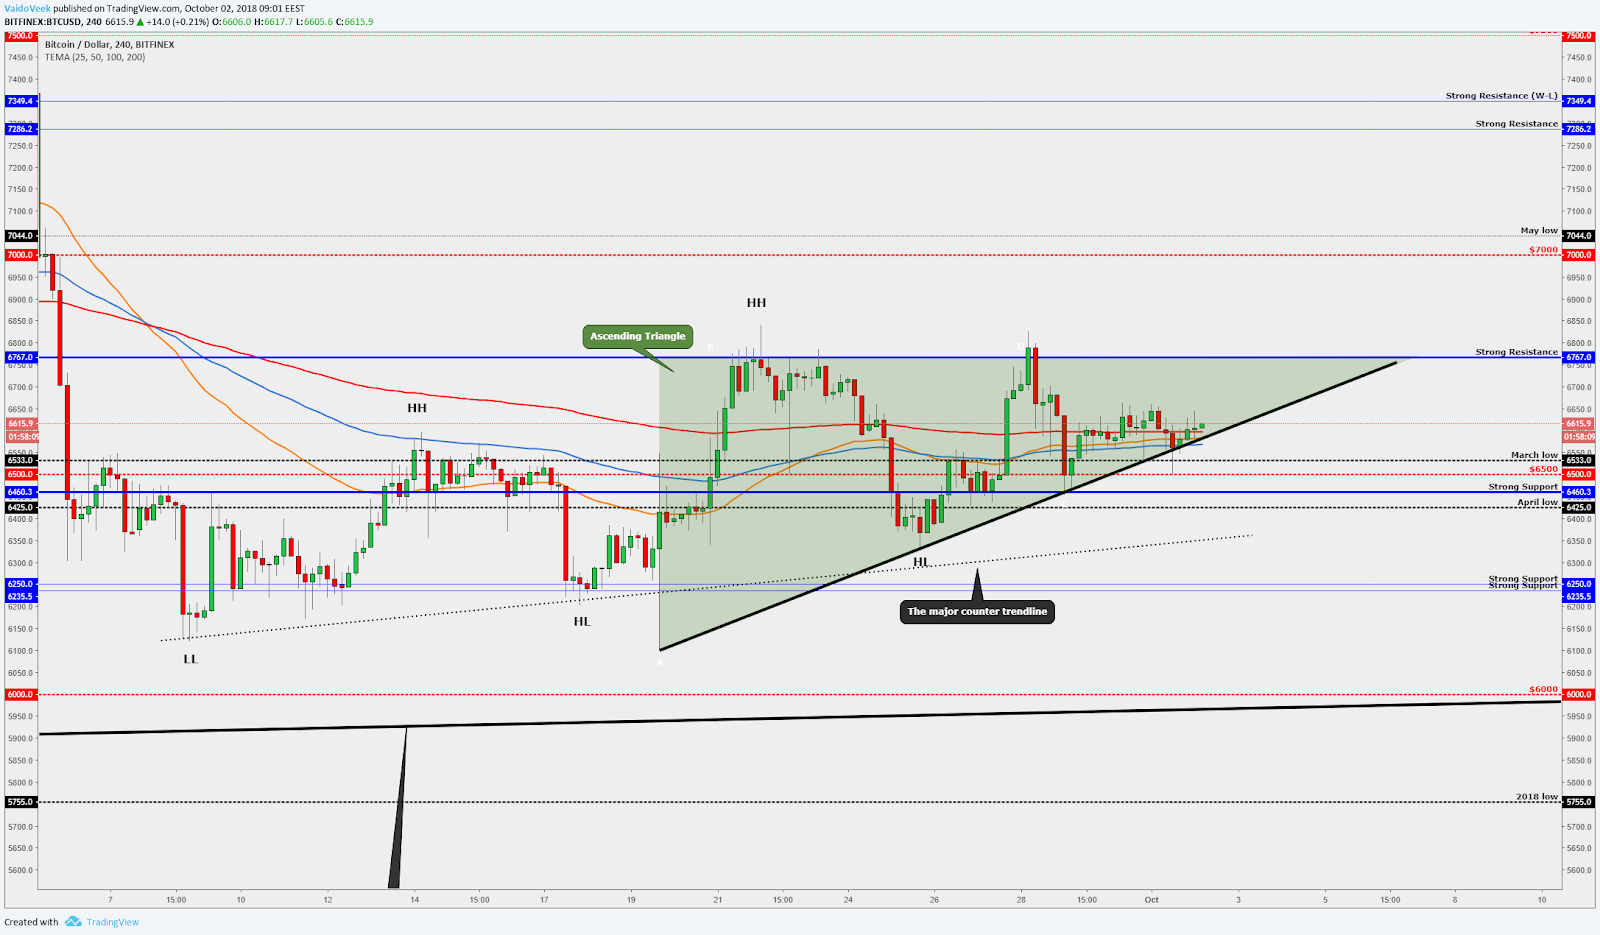
If we look at the daily chart again, we got a bullish candlestick pattern called "hammer" (hammers are everywhere), this is the second hammer in the three days period, and it shows that buyers have the power to hold the price up even if sellers tried to push it down multiple times.
Now, here is a question- do the bulls have the power to hold the price up and can they start climbing higher or are they out of steam? Maybe the bears are finally winning the battle, and soon we will see a candle close below the trendline? The candle confirms that the bears dominate the market at the moment and we can possibly witness a leg downwards. We are really on the edge, and anything can happen, but technically it looks more bullish than bearish.
Litecoin (LTC/USD) is on the upwards channel
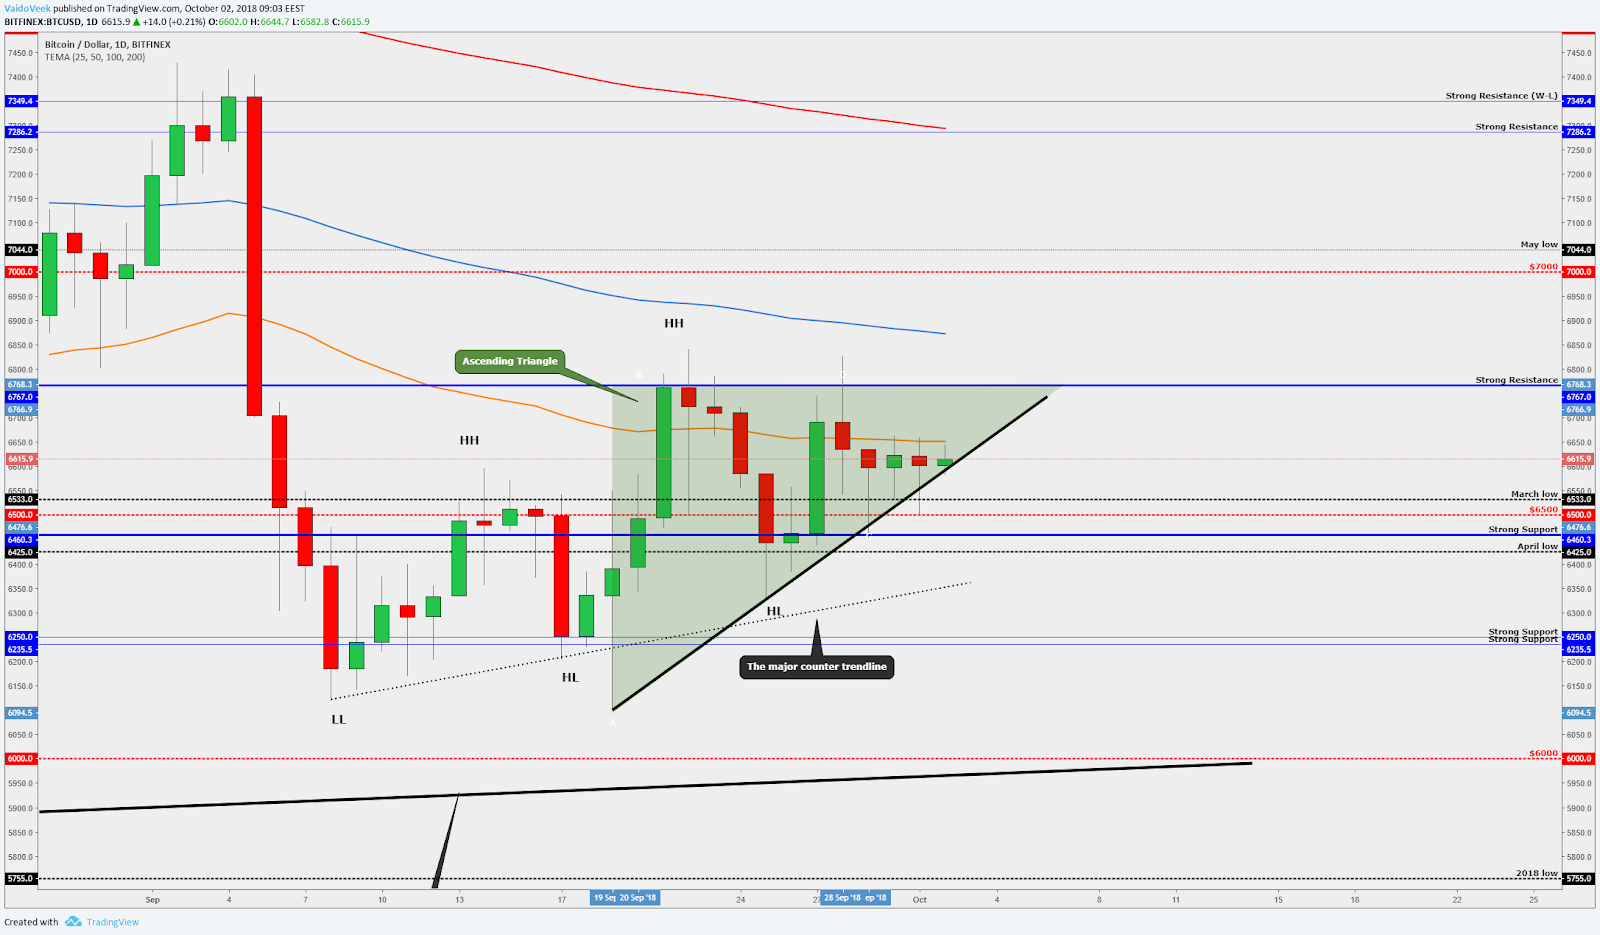
Litecoin looks 'healthy' with the upwards channel and with the clean higher highs (HH) & higher lows (HL). Currently, LTC price has found a good support area from the round number at $60. This area matches exactly with Fibonacci retracement 50 percent. Two times tested ($60) and two times it got a bounce upwards. The EMA's are around the round number area and that makes this support level even harder to break.
We have a golden cross between 200 and 50 EMA, which also indicates that we are on the bullish mode but at the moment. In order to get a leg upwards, we have to break the blue line, the strong resistance area.
Lately, six attempts failed, and it shows that if we want to be bullish then firstly, we have to take down the blue line which works as a resistance. The target would be slightly below the $70 where the minor trendline and the channel trendline crossing area plus the round number are. All those might work as a resistance, and the first short-term target should be there.
The bearish confirmations would be a candle close below the round number $60, a candle close below the channel trendline (counter trendline) and probably the first stop is around $54-$55. These are the latest support level and previous higher low.
Ripple (XRP/USD) possible scenarios & possible targets
At the moment, Ripple is one of the most discussed altcoins, it has made very good and profitable rallies.
Currently, we could see that we trade between the two levels, the May low which works as a support at $0.544 and the round number at $0.6 which functions as a resistance.
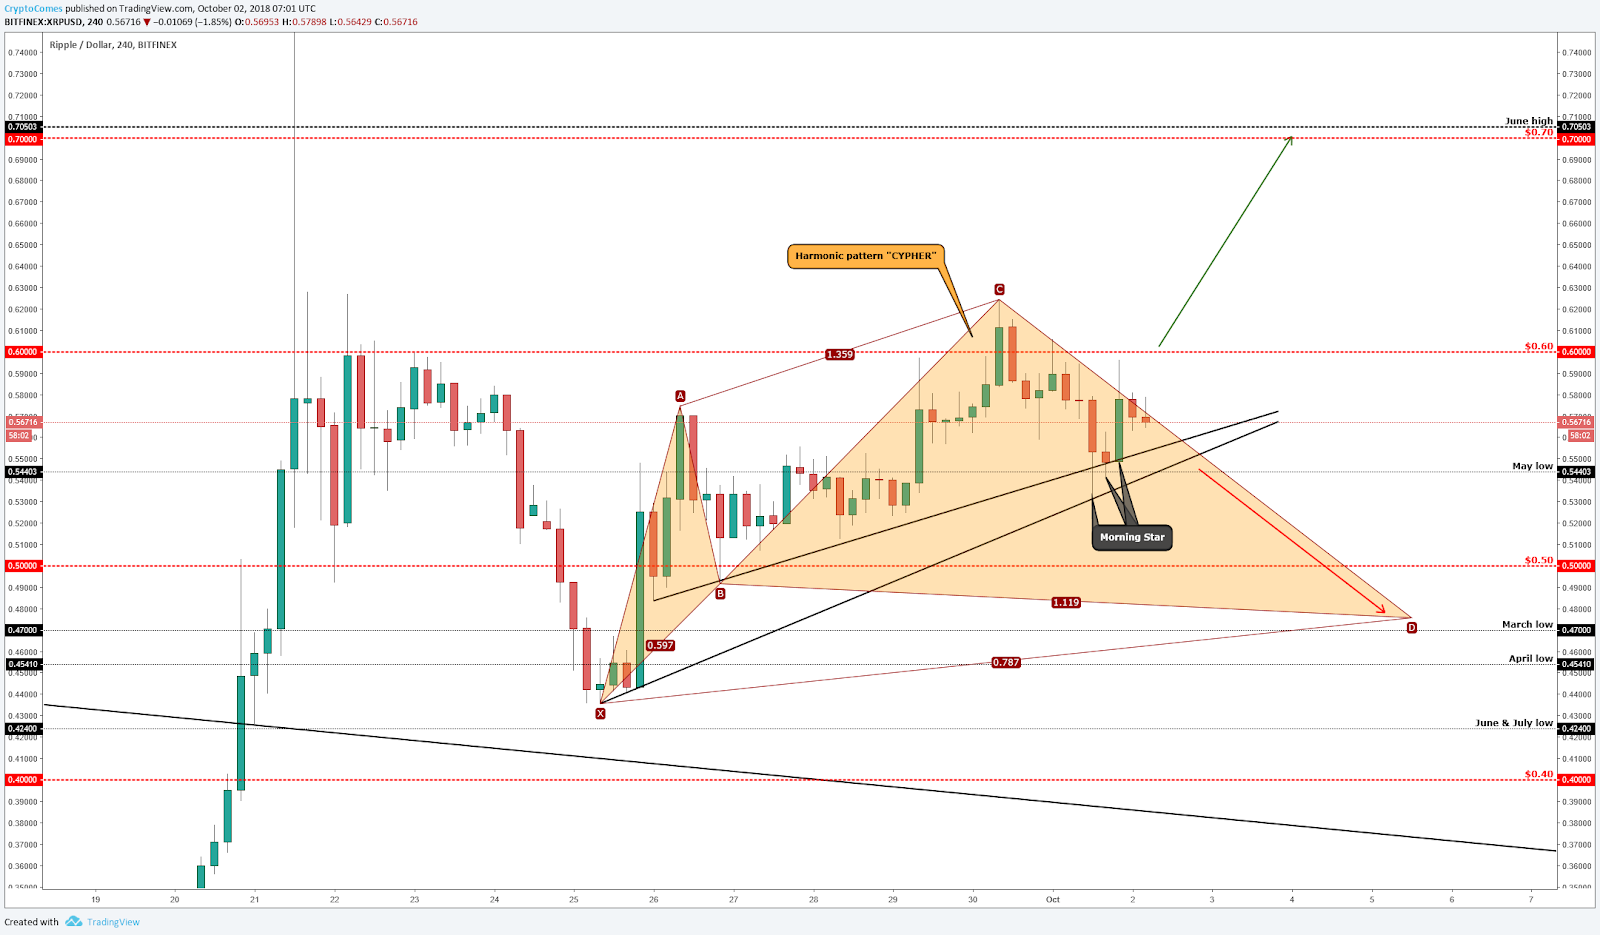
Yesterday, we got a bounce upwards from the May low, and it forms a bit sloppy bullish candlestick pattern called "Morning Star.” The momentum pushed quickly down, and the price stayed stable. This throwback (movement downwards) gave us an opportunity to draw a trendline from the Sept. 25 low point.
To confirm a bearish price action then a candle close below the mentioned trendline and below the minor trendline which is smoother, will indicate that we will see a little throwback. As you see on the chart, there is a harmonic chart pattern called "Cypher," and the cypher shows that the possible target (if we start to move down) is around $0.475, between the March low point and the $0.5.
To confirm bullishness, firstly, we have to take down the resistance at $0.6. One attempt was successful, but this was a fake-out, the bears brought the price quickly back below the $0.6, and the attempt was failed. If Bulls win this battle and Ripple manages to break above the round number, then the possible next target could be around $0.7 because between the breakout and the target zone is nothing remarkable which will harden the price movement.
 Dan Burgin