
*** Please note the analysis below is not investment advice. The views and opinions expressed here are solely those of the author and do not necessarily reflect the views of U.Today. Every investment and trading move involves risk, you should conduct your own research when making a decision.
Bitcoin complete breakdown
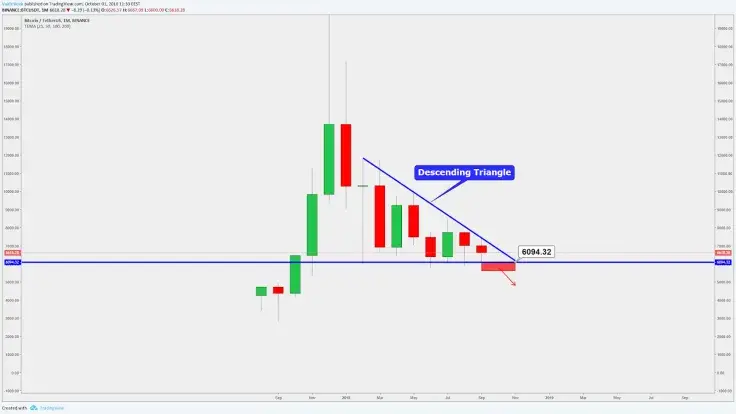
Monthly chart:
On the monthly chart, we could see that there is a significant level of around $6,100. BTC price has founded a support from the blue line (~$6,100) six times (Last year November and this year February, June, July, August & September). This will show that currently, a monthly candle close below the $6,100-$6,300, guides us definitely to the lower levels and that also confirms the chart pattern called "descending triangle,” which will indicate bearishness on the monthly time frame. To be bullish on the monthly chart we just have to break above the upper trendline, easy to say but hard to achieve, but let's find out how hard it would be.
Weekly chart:
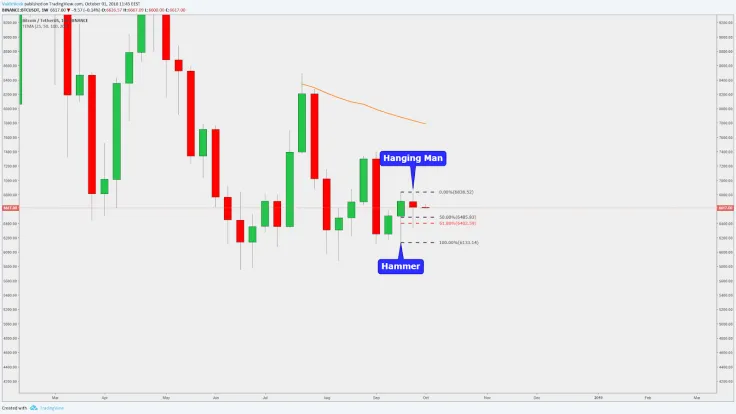
Two weeks ago we got a bullish candlestick pattern called "hammer,” we lost momentum and now, the last week brought us a bearish candlestick which is called "hanging man,” but this "hanging man" isn’t as bearish as it looks. After the impulse wave (hammer week) always comes to a pullback/throwback (previous week) and that is what's happening now. We’ve got a bullish "hammer,” we’ve got a nice and healthy throwback (movement downwards), and we’ve got a nice bounce-back upwards from the perfect Fibonacci retracement level of 62 percent. So, this "Hanging Man" is not so bad.
Daily chart:
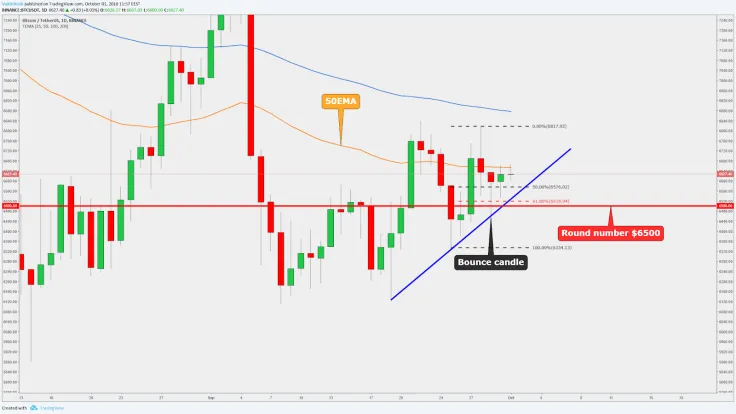
On the daily chart, we could see that the bounce on the weekly chart from the perfect Fibonacci level brought us an opportunity to draw a counter trendline (short-term trendline upwards). BTC price moved upwards, and it came down again Saturday, and the following is almost same as on the weekly chart. The bounce came from:
* The Fibonacci golden ratio of 62 percent
* From the round number $6,500 which worked as a support level
* From the mentioned trendline
* ...and after the bounce, we got a bullish "hammer" candlestick pattern.
Currently, on the daily chart, BTC price fights with the 50 EMA, this is our first obstacle what we have to take down before we can start to climb higher.
Four-hour chart:
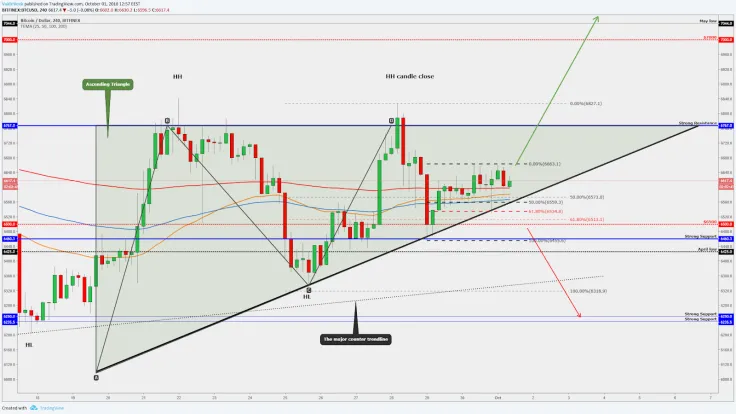
As you’ve already seen Bitcoin price is on the big "ascending triangle.” Yesterday evening we got a candlestick pattern which guides us above the all-important EMA's again and this pattern is the "hammer.” So, we have a hammer on the weekly chart, we have a hammer on the daily chart and we have a hammer on the four-hour chart. The hammer on the four-hour chart got a bounce upwards from the triangle bottom trendline (the major counter-trendline) and again from the perfect Fibonacci retracement level of 62 percent. So, currently, the market moves symmetrically upwards from the golden Fibo retracement levels.
This all indicates that we might see an upwards breakout from the "ascending triangle.”
Bearish confirmation:
In the bigger picture (monthly chart), the overall trend is down and that's why it is easier to break downwards from the current triangle. If we see a candle close below the triangle trendline and below the blue line, let's say around $6,420, then it would be a bearish confirmation. It confirms that the bullish momentum is gone and the strong support level doesn't work anymore, the next stop would be on the major counter trendline which is around $6,300. Be careful in this scenario!
Summary:
The monthly is the only time frame which has a bearish pattern, so, this could show us that in order to invest in the long term you have to wait a little bit to get better confirmations. But in the shorter time frames, we have several bullish signs, and if they start to work nicely then we could find a momentum and it will begin to climb upwards. So, short-term and technically, we would like to say that we are bullish.
 Arman Shirinyan
 Alex Dovbnya
 Denys Serhiichuk
 Gamza Khanzadaev