
The leading cryptocurrency has undergone a massive correction of a parabolic uptrend, which has been relevant for more than two weeks. It is noteworthy that the fall was accompanied by a substantial increase in trading volumes on the exchanges.
For example, one of the world's largest platforms, Binance, registered $2.1 bln in total.

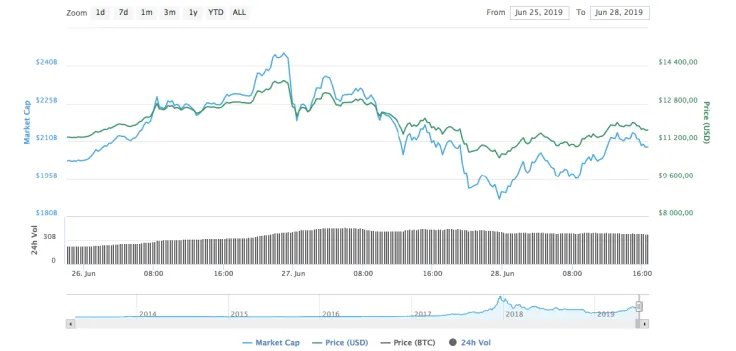
However, the fall did not last too long; on June 28, Bitcoin held a rally, having added more than 6% per hour: the price rose from $10,300, to $11,908, which also affected the rise in prices of some altcoins.
Over the quarter, BTC has increased by 183%, which is the best indicator in the last 1.5 years.
What is more important, Bitcoin has set the new trading volume index over the 24 hours of more than $46 bln.
Another record was fixed on the CME platform, where Bitcoin contracts worth $1.7 bln were exchanged. This is the highest level ever recorded, both in terms of the number of contracts exchanged (29,225) and in terms of value.
From a technical point of view, Bitcoin has followed our scenario, and the price rolled back to the corridor of $11,500-$11,800.
The price of Bitcoin turned out to be within the descending channel while forming a structure of declining highs and lows. All this happened against the background of relatively high trading volumes.
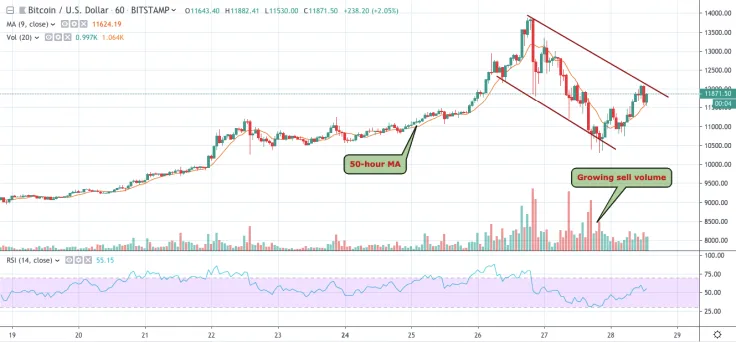
Another bearish signal can be considered RSI in the region of 50. The probable continuation of the correction is indicated by the breakdown of the moving average (MA) with a period of 50.
Thus, continuing the fall, the price may be in the range of $10,000-$10,300.
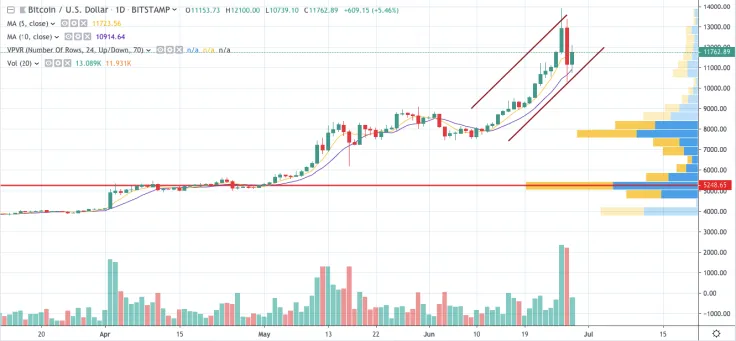
On the daily time frame, the situation is different. Bullish structures from rising highs are still relevant. Besides, MA 5 and 10 are directed to the “north”. Thus, in a more extended period, the path of least resistance lies up.
The price of BTC is trading at $11,814 at the time of writing.
 Dan Burgin
 U.Today Editorial Team