Disclaimer: The opinions expressed by our writers are their own and do not represent the views of U.Today. The financial and market information provided on U.Today is intended for informational purposes only. U.Today is not liable for any financial losses incurred while trading cryptocurrencies. Conduct your own research by contacting financial experts before making any investment decisions. We believe that all content is accurate as of the date of publication, but certain offers mentioned may no longer be available.
Cardano's trading close to $0.87, but the charts do not look the same across different time frames. On the shorter time frame, ADA seems like it could go higher, but the daily chart does not look as good, with the Bollinger Bands showing pressure that could hold it back before it really breaks out.
On the 4-hour and 12-hour charts, ADA has been bouncing off the $0.82-$0.85 area a few times. That zone has become a short-term base, and as long as it holds, a move through $0.90 looks possible. If that happens, the price might move closer to $0.94, which could keep intraday action biased to the upside.

The daily picture is different. The Bollinger Bands show the price struggling with the $0.85 midpoint. Instead of acting as support, that line has become resistance, and the upper band near $0.98 has not been tested since early August. That makes the chart look heavier.
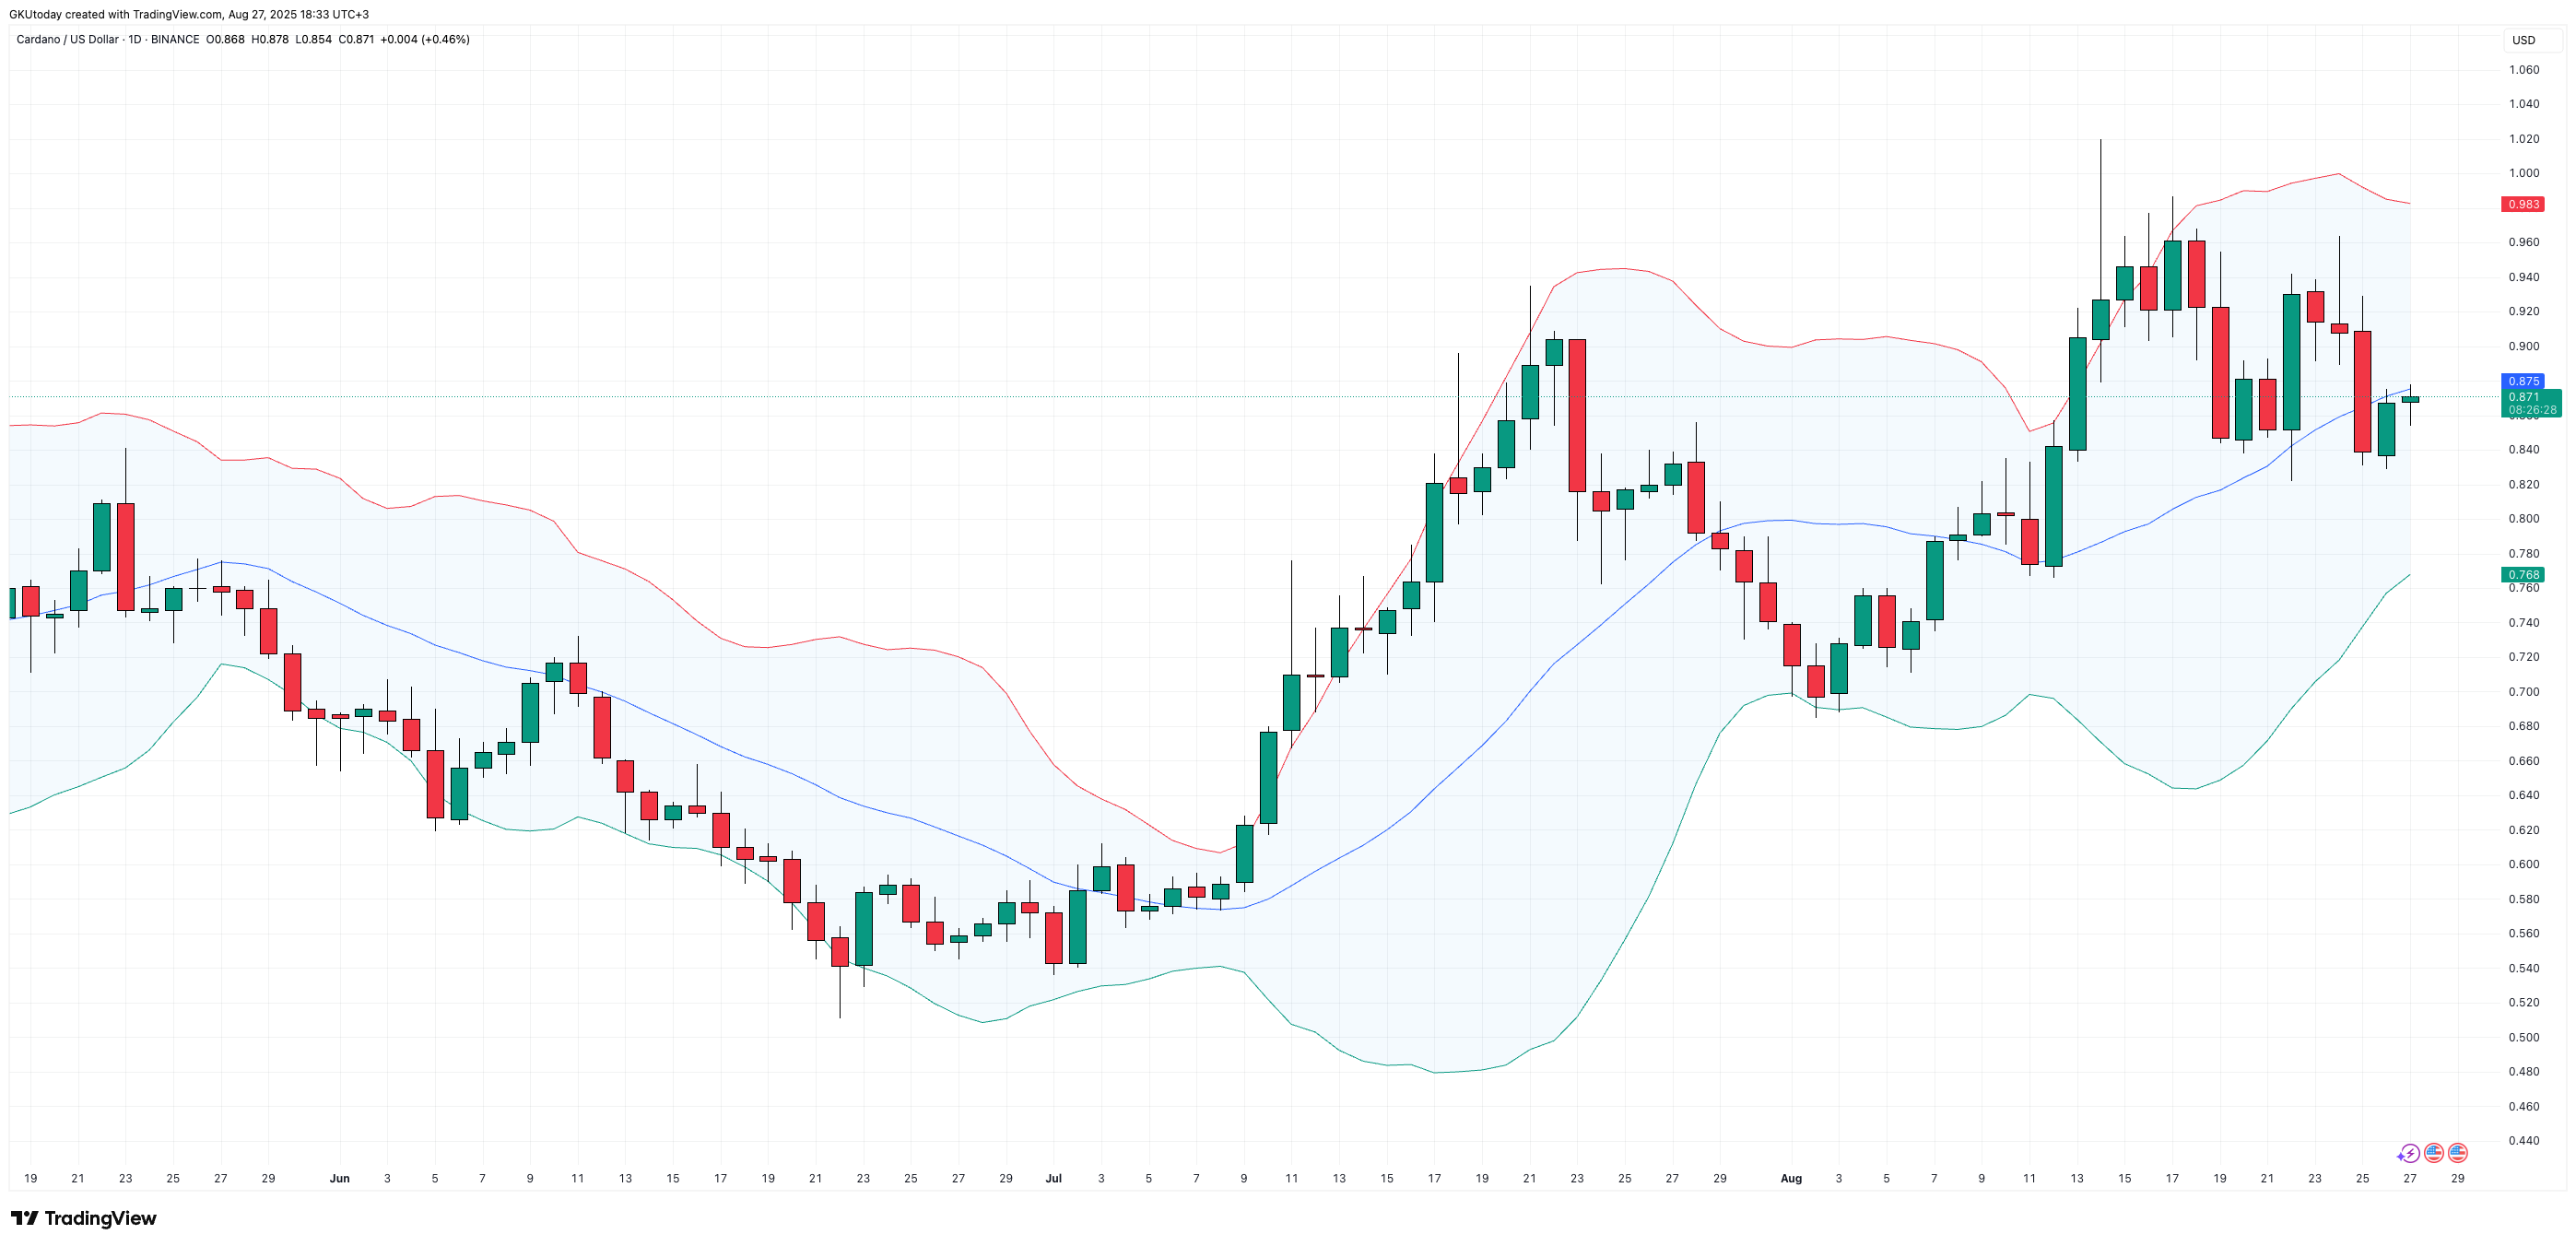
If the coin fails to stay above $0.85, another dip toward $0.82 or even $0.76 is possible.
In the end, what?
The weekly chart shows $0.96 as the focus. ADA has been capped under that level all year, and a clear move above it would mark a real reversal of the longer trend.
Basically, Cardano's price success depends on the timing. If the time frames are smaller, the daily will lean down, and the weekly might show a bigger move if $0.96 is cleared. Right now, it is a roller coaster ride — up, down and maybe up again, depending on the chart.
 Dan Burgin
 U.Today Editorial Team