Disclaimer: The opinions expressed by our writers are their own and do not represent the views of U.Today. The financial and market information provided on U.Today is intended for informational purposes only. U.Today is not liable for any financial losses incurred while trading cryptocurrencies. Conduct your own research by contacting financial experts before making any investment decisions. We believe that all content is accurate as of the date of publication, but certain offers mentioned may no longer be available.
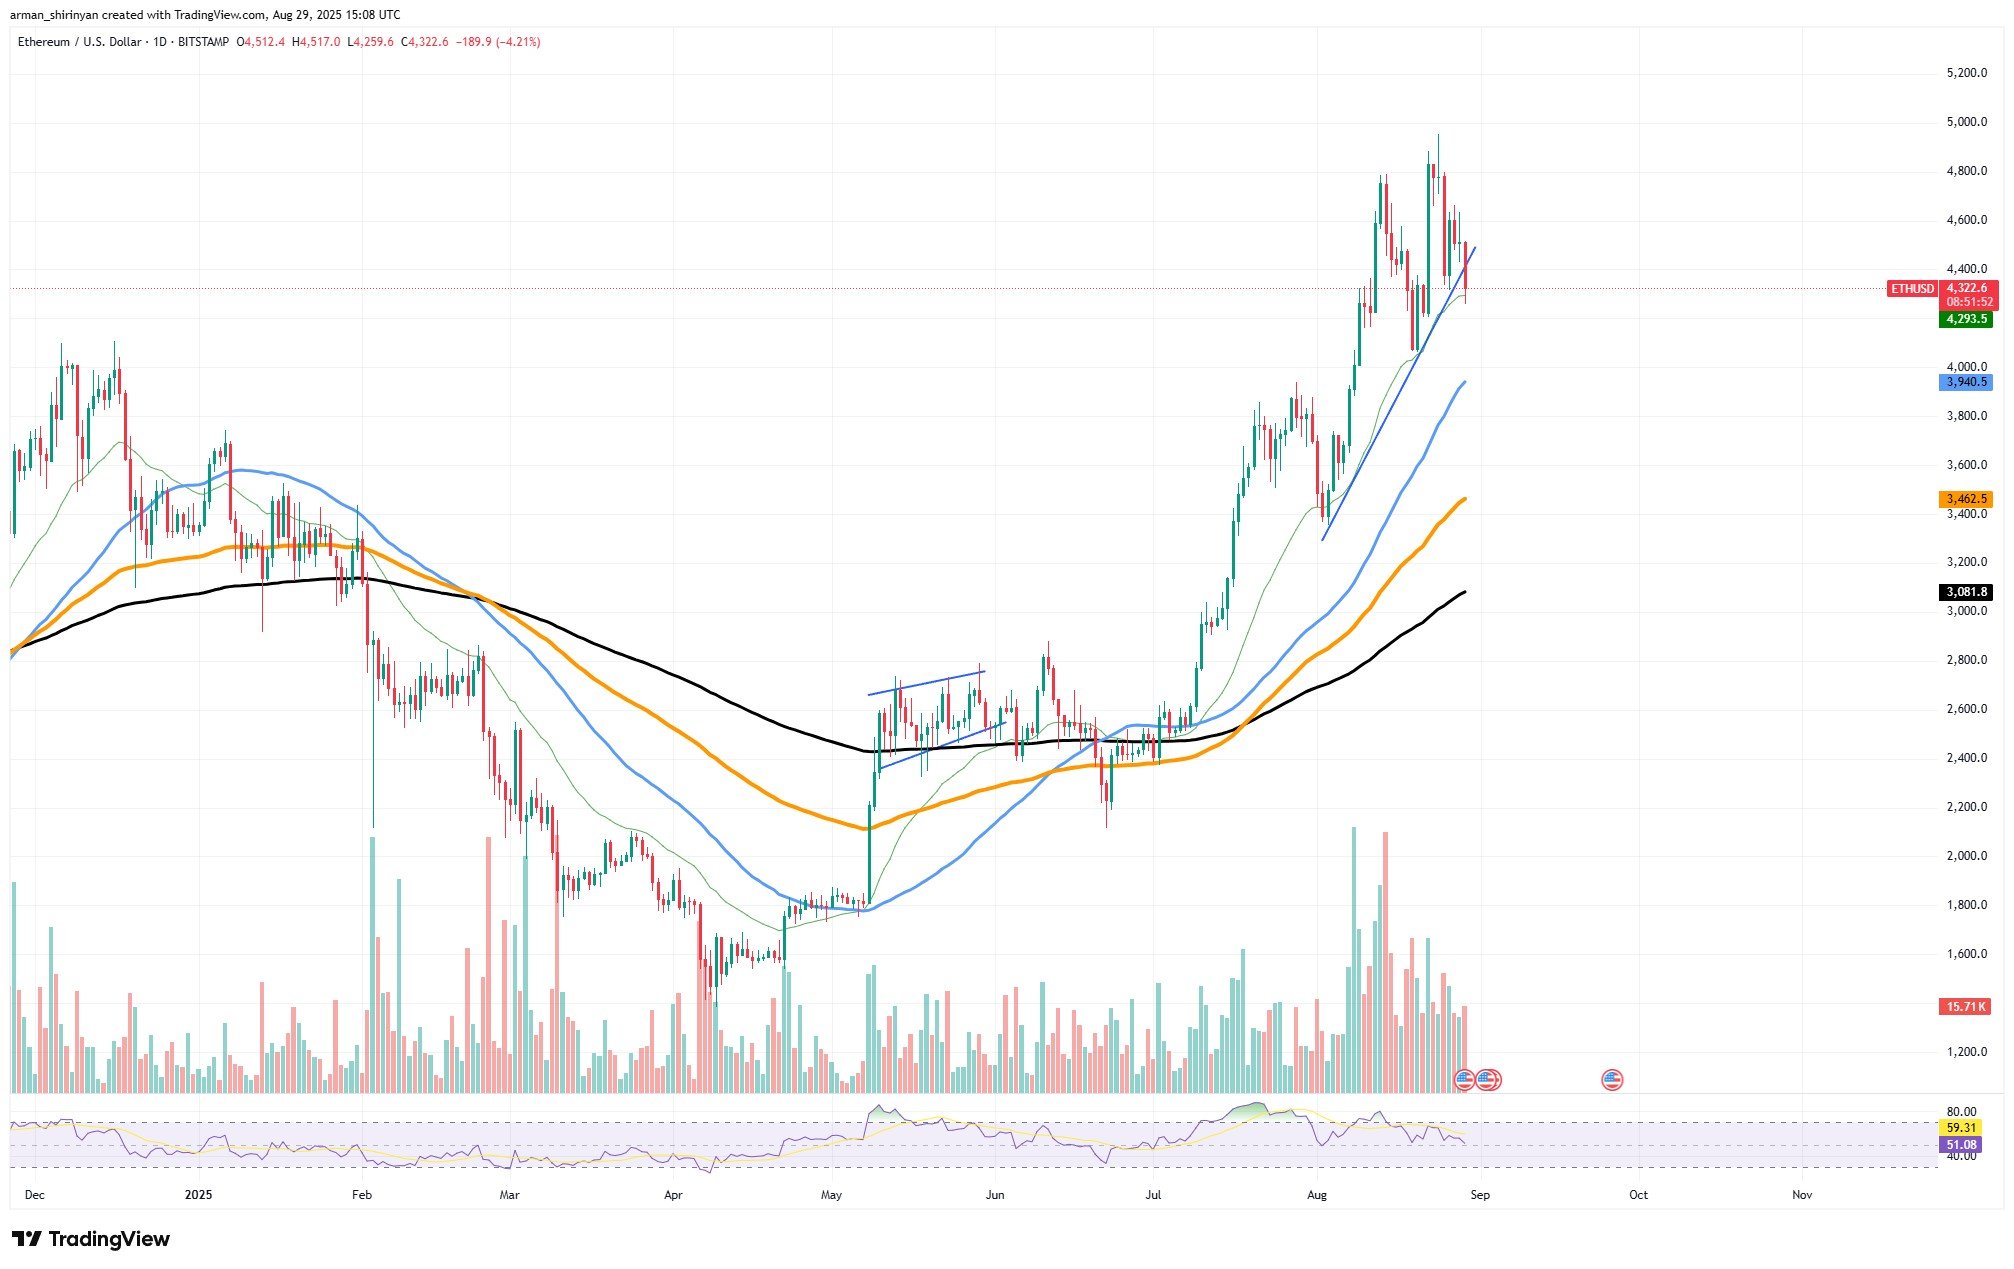
After a severe correction, Ethereum recovered and is now firmly above the $4,300 support zone, demonstrating its resilience. The daily chart’s structure indicates that ETH may be poised for another surge toward the $5,000 milestone, suggesting that the recent pullback may have reached its end.
The 50-day EMA has been a dynamic support for ETH’s strong recovery over the last few weeks. The recent uptrend has seen shallow corrections that have been swiftly followed by fresh buying pressure. This kind of market behavior reflects strong investor confidence, a necessary ingredient for pushing ETH into uncharted territory.

The RSI at 59 indicates that there is space for a new rally, as ETH has cooled off from overbought conditions. In contrast to earlier this year, volume is still high, even though it has been decreasing during the correction phase.
In the upcoming sessions, ETH may retest recent highs around $4,800 and push above them toward $5,000 if volume increases. Nevertheless, Ethereum’s rallies are infamously erratic. Investors should keep in mind that even though the chart structure encourages continuation, parabolic advances frequently come to an abrupt end.
Deeper corrections could return to the 200-day EMA around $3,400 if the price fails to stay above $4,200. The path of least resistance is still up for the time being. With investor interest, momentum recovery and structural support, ETH is well-positioned to try another breakout.
The $5,000 drive might happen sooner rather than later if momentum is in favor of it, but traders need to be on the lookout because Ethereum rallies have a history of reversing as fast as they start.
XRP's critical breakdown
Now hovering just below the crucial $3.00 level, XRP is getting closer to a definitive breakdown. Instead of providing bullish potential, the symmetrical triangle pattern that has been tightening over the past few weeks appears poised to tilt toward the downside, according to the charts.
As of press time, XRP is trading close to $2.82 and has already started to decline below short-term support. By confirming the formation’s increasing weakness, this price action raises the possibility that the market is getting ready to continue its downward trend.
While the triangle’s breakdown is a bearish signal in and of itself, it becomes even more dire when combined with declining volume. If this happens, XRP may quickly decline toward its 200-day EMA, which is located around $2.50. This level serves as both technical support and the next psychological safety net for investors.
If this were to drop, selling pressure would probably increase, and XRP would likely see more significant corrections. There are no indications of reversal divergence, and the RSI at 42 indicates bearish momentum. This implies that buyers are merely unwilling to intervene at the current levels, especially when combined with the declining market participation.
XRP is probably going to continue to face pressure unless a powerful catalyst appears, like an abrupt market-wide recovery.
In summary, the symmetrical triangle of XRP has successfully moved from a consolidation zone to a breakdown structure, and investors should brace themselves for a decline toward $2.50 unless $3 can be recovered quickly. Given the market’s fragility, XRP might not have much left to hold onto before more declines occur.
Shiba Inu anemic
The price of Shiba Inu, which is currently trading at around $0.0000122, is still consolidating inside a tightening symmetrical triangle. The lack of momentum leading into the weekend is what makes the current setup so important, even though the pattern has been developing for a few weeks.
The daily trading volume has stagnated, and SHIB has historically had little-to-no liquidity on weekends. This implies that once more market activity resumes next week, the true direction will probably become apparent.
It is evident from the technical picture that SHIB is being squeezed between the lower edge of its triangle support and the 50-day, 100-day and 200-day EMAs' strong overhead resistance. An explosive breakout is anticipated in the future if price coils more inside this structure without volume.
Because SHIB has continuously failed to reclaim higher resistance zones throughout August, the overall trend remains bearish, which presents a challenge for bulls. With neither bulls nor bears fully in control, the RSI at 44 indicates weak momentum.
However, SHIB might swiftly decline toward $0.0000110-0.0000100, a region that offered stability earlier this year, if the lower triangle support gives way. On the other hand, any significant recovery would require a bullish breakout above $0.0000135-0.0000140, but this move appears unlikely in the near future without volume.
Shiba Inu investors are unlikely to find answers this weekend. When volume resumes the following week, the market will decide whether SHIB can withstand another round of selling pressure or not. This is when the real test starts. The next course of action will probably decide SHIB’s short-term future since the triangle is getting close to its apex.


 Arman Shirinyan
 Dan Burgin
 Alex Dovbnya
 Denys Serhiichuk