Disclaimer: The opinions expressed by our writers are their own and do not represent the views of U.Today. The financial and market information provided on U.Today is intended for informational purposes only. U.Today is not liable for any financial losses incurred while trading cryptocurrencies. Conduct your own research by contacting financial experts before making any investment decisions. We believe that all content is accurate as of the date of publication, but certain offers mentioned may no longer be available.
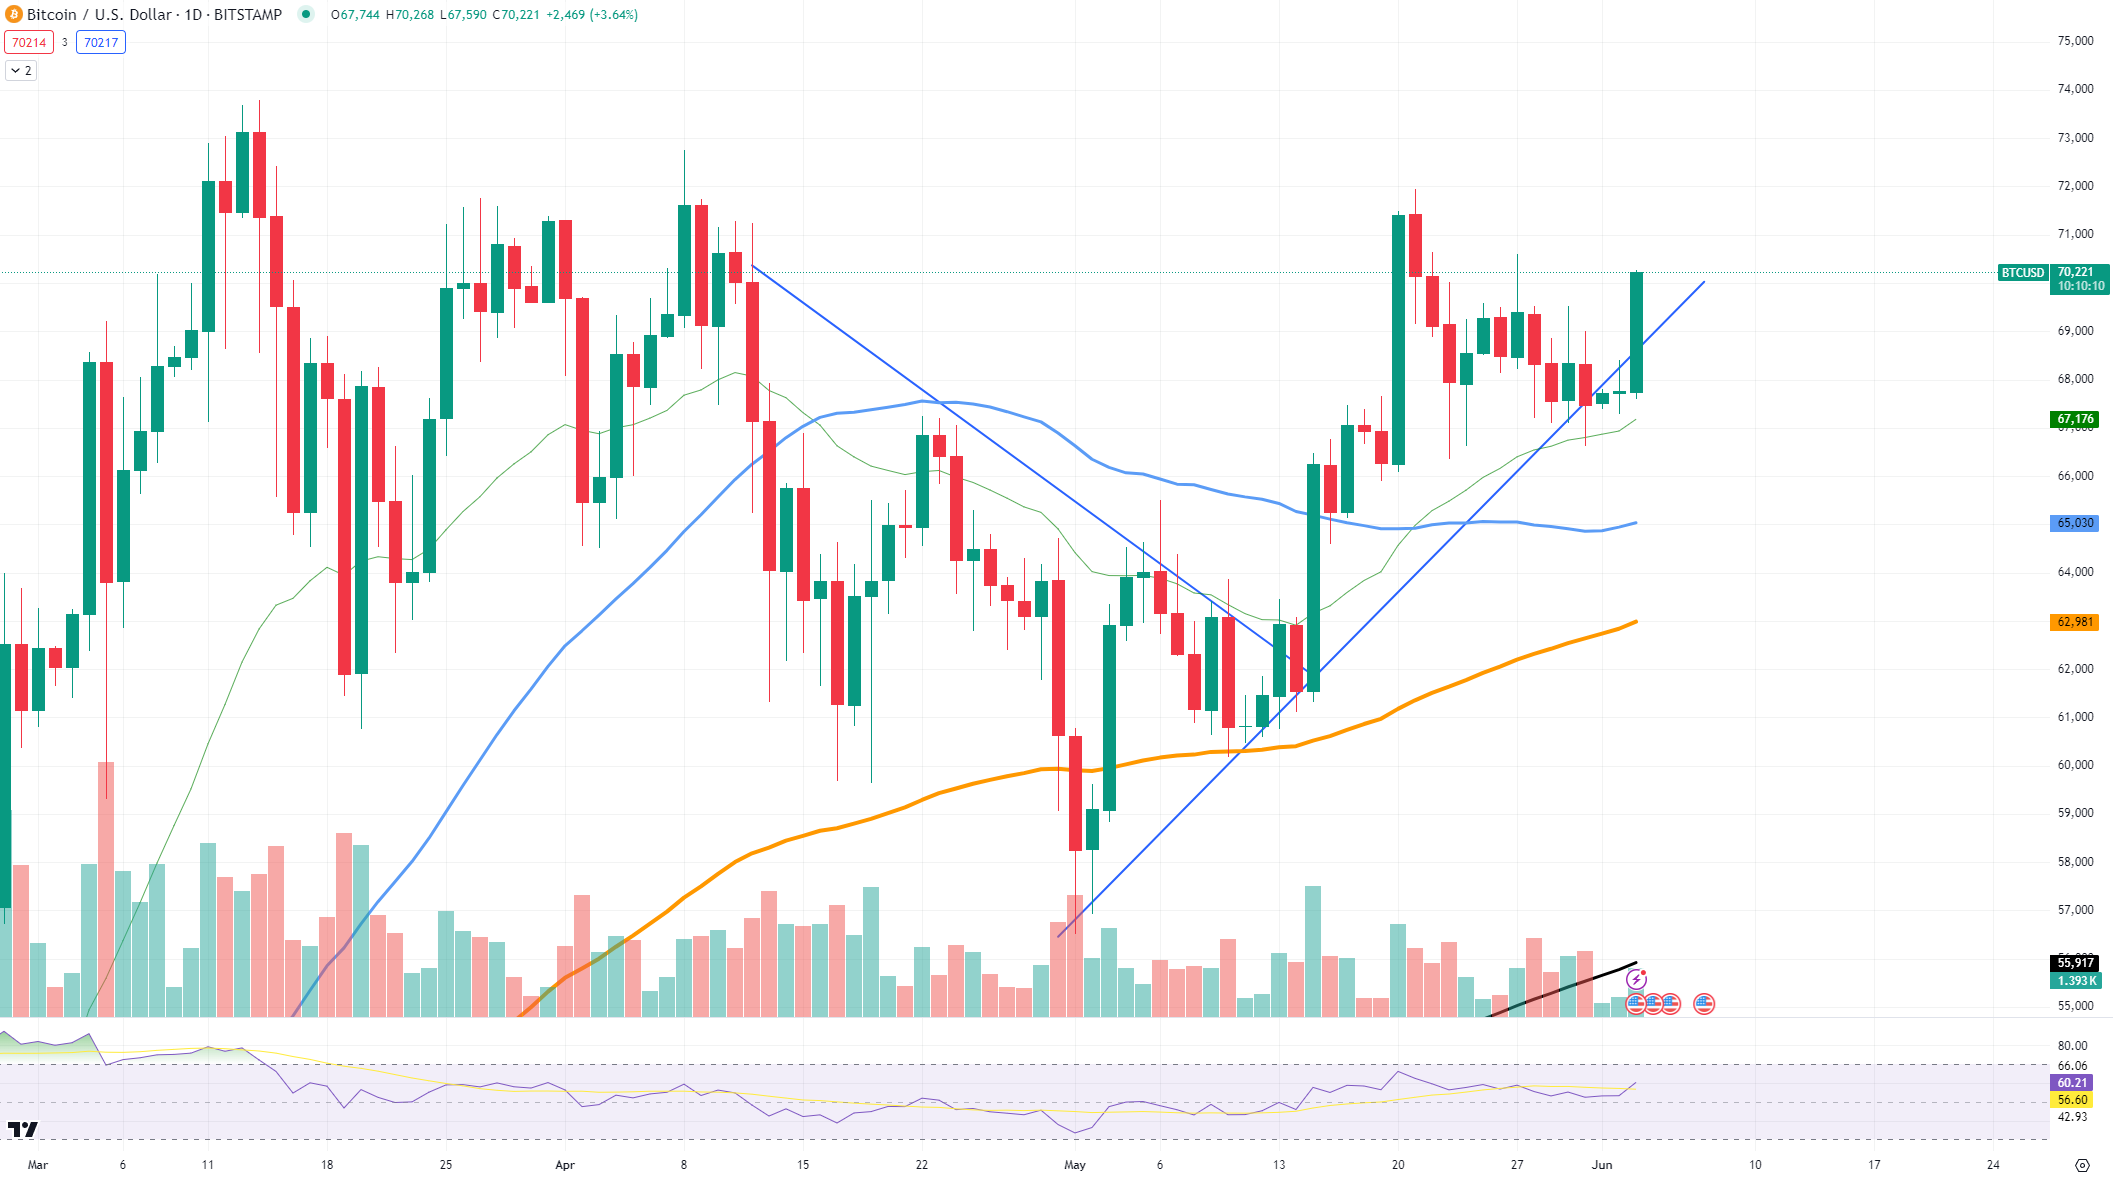
Bitcoin did not give up on the $68,000-$70,000 price range and might be gaining some momentum for a breakthrough attempt. The digital gold is currently trading at around $69,000, bouncing off of the 26 EMA. However, $69,400 is a significant resistance threshold that may cause some serious trouble if BTC does not gain enough momentum.
As Bitcoin attempts to break through the critical $70,000 barrier once more, the BTC/USD chart shows a bullish sentiment. The price has demonstrated resilience and the possibility of upward movement by recently rebounding off the 26-day Exponential Moving Average.

This rebound implies that buyers are intervening and giving the market the support it needs to remain above $68,000. Currently Bitcoin is battling the $69,400 resistance level, a critical point that has historically been challenging to surpass. If this level is not broken, there could be a reversal toward $70,000 and lower.
A correction may find additional support at the 50-day EMA and the 100-day EMA, which are both positioned below the current price. The trading volume has increased somewhat, suggesting that traders are becoming more interested and involved. Any meaningful price movement must be sustained by this volume spike.
XRP's questionable state
XRP is currently in a mixed state: on the one hand, the asset is still heavily suppressed; on the other, it is gaining some power and potentially even gaining some strength for a bounce. One way or another, it is still moving under the 50 EMA and definitely has to break through in order to be considered a bounce contender.
Given that XRP has not yet been able to decisively break through the 50-day EMA it is especially important. If the price continues to rise above this barrier, it may be a sign that buyers are taking charge and driving up the price. But the bearish attitude might still be prevalent as long as XRP stays below this mark.
The low trading volume may indicate a lack of confidence among traders. XRP will require more trading volume to sustain the price movement in order to create a successful recovery. Strong participation is usually indicated by high volume, which can also confirm the direction of the price trend. The RSI is in a neutral zone, at around 50 and does not provide any substantial insight.
Ethereum's issue
Ethereum is clearly facing some struggles as the asset has stayed in the same trading range for the last few weeks. Considering the trading volume, it is not the issue, since bears are not really ready to push it downwards. But there is also an important factor to consider: the exhaustion of bulls.
The Ethereum/USD chart indicates that the cryptocurrency has been settling into a small range, approximately ranging from $3,750 to $3,850. The price has not broken out considerably higher despite prior bullish momentum suggesting a possible plateau. Although sellers are not actively bringing prices down this stagnation may be the result of bullish exhaustion, in which buyers lack the power to drive prices higher.
More context is given by the chart's moving averages. But failing to break above the present resistance level around $3,850 might indicate a consolidation phase or even a possible retreat. The current range needs to be broken, and volume analysis indicates that trading activity has not increased significantly.
Increased market participation would be indicated by a spike in volume, which might encourage a breakout. The low but consistent volume for the time being indicates that traders are waiting to see what will happen before making a big move. Ethereum is getting close to overbought conditions, as indicated by the RSI, which is currently trading between 60 and 70. Even if it is not a drastic scenario, it implies that the upside potential might be constrained in the absence of a market correction or consolidation period.


 Caroline Amosun
 Tomiwabold Olajide
 Dan Burgin
 Gamza Khanzadaev
 Arman Shirinyan