Disclaimer: The opinions expressed by our writers are their own and do not represent the views of U.Today. The financial and market information provided on U.Today is intended for informational purposes only. U.Today is not liable for any financial losses incurred while trading cryptocurrencies. Conduct your own research by contacting financial experts before making any investment decisions. We believe that all content is accurate as of the date of publication, but certain offers mentioned may no longer be available.
Following a failed breakout attempt, Shiba Inu is clearly showing weakness, leading traders to wonder if the recent rally was more than a fleeting fakeout. The price is currently trading below both the 200-day EMA and the 50-day EMA, indicating that the most recent rejection at the 200-day EMA was a clear bearish signal.
Momentum gone
Bullish momentum is insufficient to maintain upward movement, particularly when confronted with significant moving average resistance, as this technical rejection makes clear. Despite the fact that volume has been increasing, bulls do not want to see this kind of volume increase because it moves toe-to-toe with a price decline, which indicates that sellers are actively cutting prices.
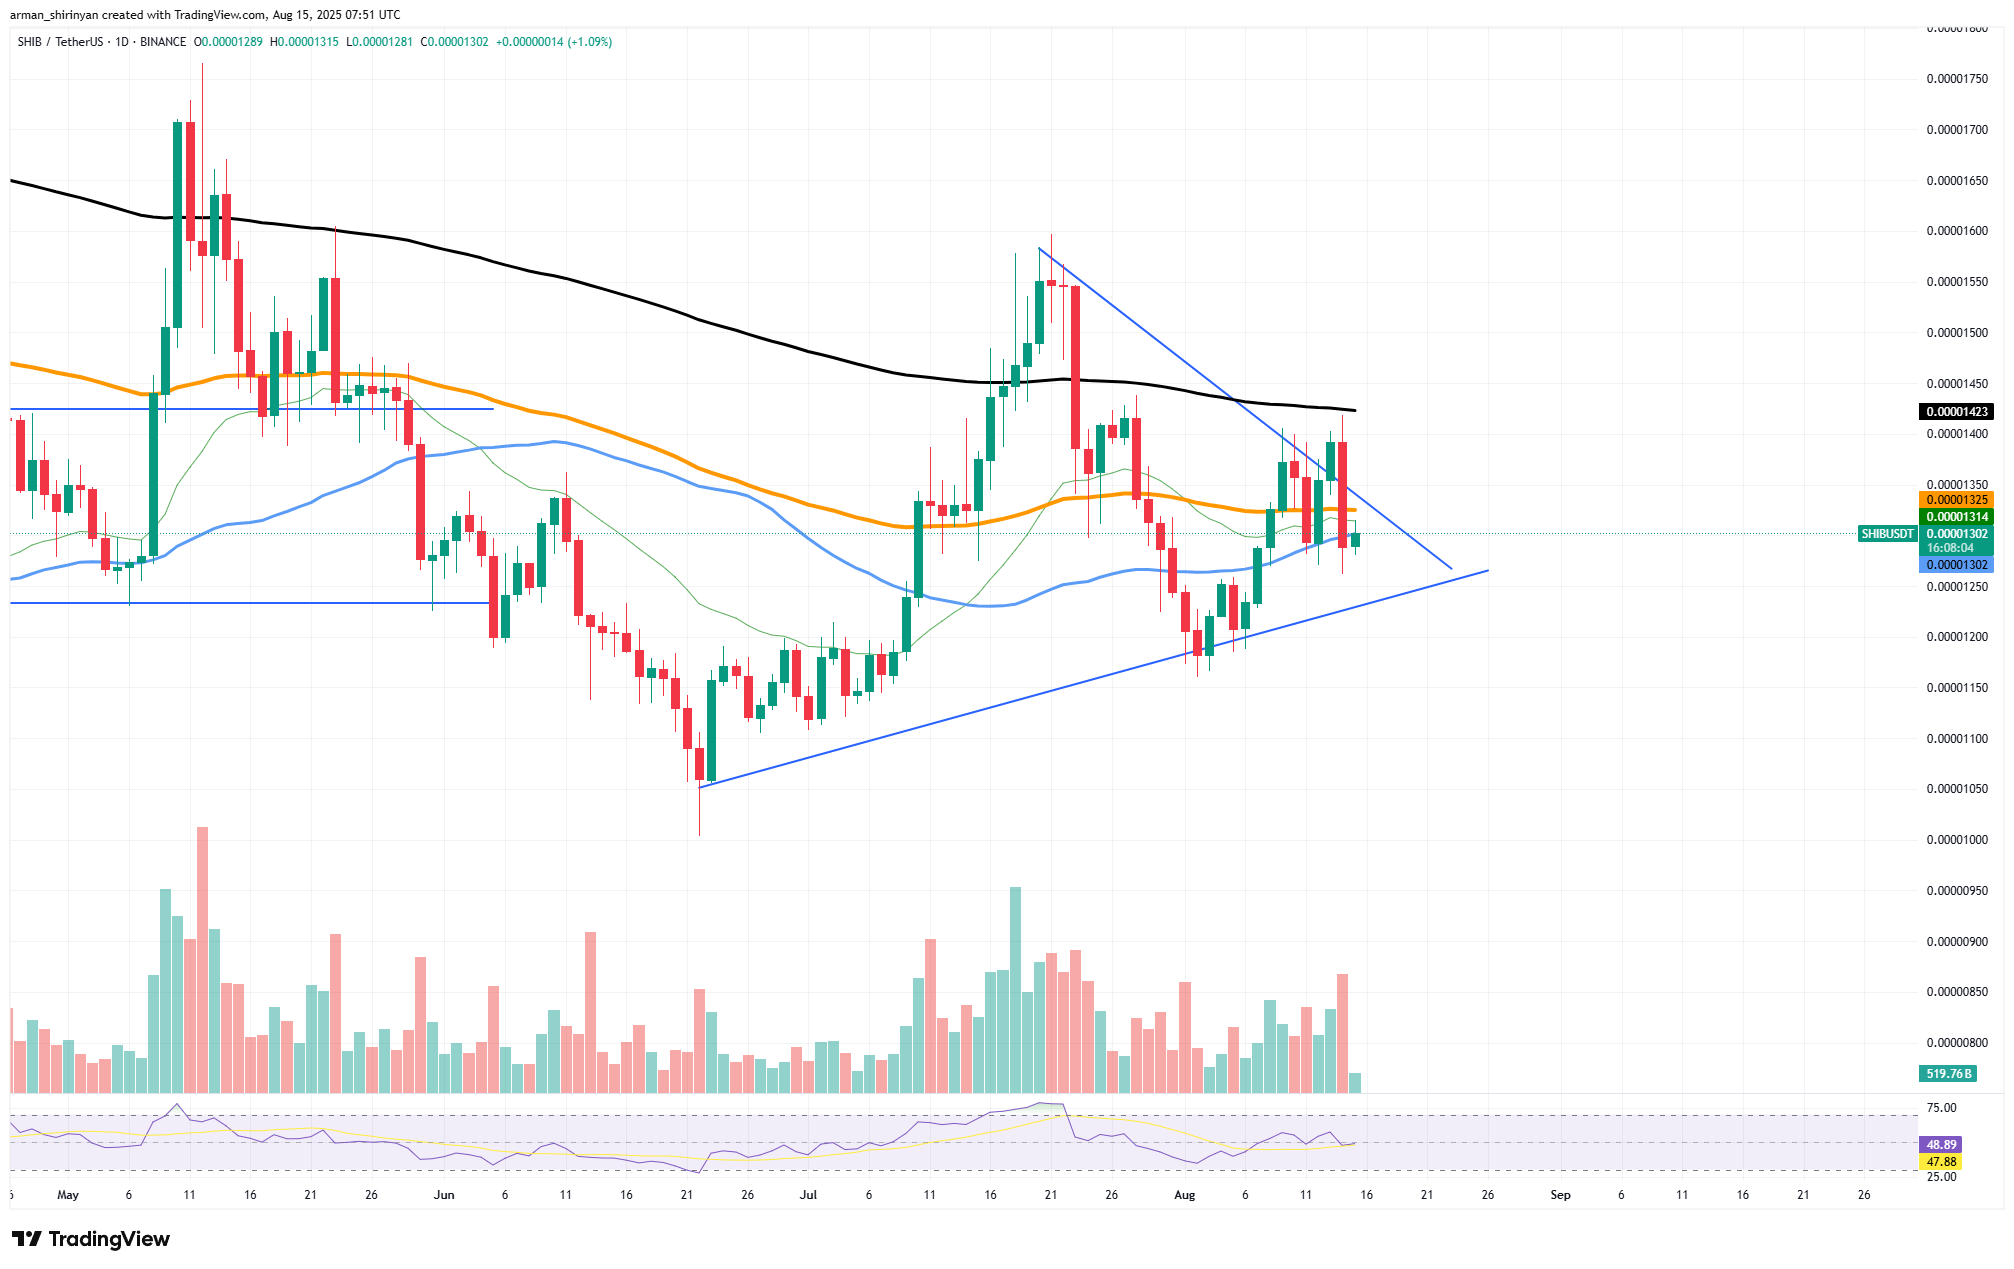
Over the past few weeks, a symmetrical triangle pattern had developed, raising the possibility of a breakout in either direction. The upside break, which was a textbook fakeout, unfortunately failed almost instantly for SHIB holders. As trapped long positions unwind, such situations frequently result in steeper declines. Three important price levels should be closely monitored by traders in the future.
Will triangle hold?
The triangle's lower boundary, or $0.00001300, is the immediate support. Near $0.00001250, where the price had previously consolidated prior to the July rally, is the next significant support if this level fails. A more severe breakdown might push SHIB in the direction of $0.00001150, which served as a base during the early summer lows.

The first step in reestablishing short-term bullish structure would be to recover $0.00001350 and close above it on high volume. Any recovery attempt, however, will encounter formidable obstacles due to the 200 EMA's position just above. The SHIB chart indicates that bulls are not yet ready to launch a potent counterattack.
Selling pressure on rising volume, a failed breakout and a major moving average rejection all suggest that things are not shaping out in favor of SHIB bulls. Downside pressure is just piling up, and you should not be surprised if descending tendencies reach even higher levels.
 Dan Burgin
 U.Today Editorial Team