
A little bit of recovery, and Bitcoin will get back to $8,000 again. Neither traders nor the cryptocurrency rush to give up – we still hold out a faint hope. However, we should have a clear understanding of how to trade Bitcoin wisely and reap maximum benefits. First, we should sustain a sharp look at Bitcoin price fluctuations: real-time monitoring of BTC price on CoinCodex is a must. Secondly, it’s crucial to work out an investment strategy. Let Bitcoin price predictions from TradingView users help you with that.
Will BTC explode?
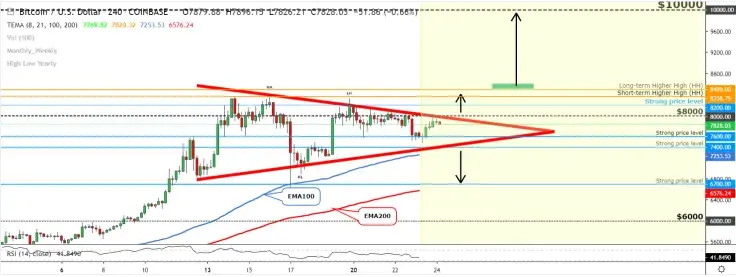
Overnight, the BTC price made a bigger descent compared to the volume of the last few days. It should be noted that the old resistance level which becomes support has worked also historically pretty nicely at $7,400. The $7,400 mark is a bit stronger level because there comes into play one part of a drawn chart pattern – triangle bottom trendline.
The triangle should be an indication that soon we will see decent action. Historically, it has guided the price nicely into the breakout directions – breakouts can occur in both direction but usually trend following breakouts are more powerful. The triangle tip is getting closer and closer, the price smashed together and it is ready to explode. Now, we just have to wait for that breakout which finally should activate a pattern. To trade inside the pattern is a bit risky. If you can do it, please go ahead but my recommendation would be to wait for a breakout.
Where and when does the breakout get confirmed? We have two possible scenarios:
-
Bullish Breakout. First bullish confirmation should come after the 4H candle close above the $8,000. Currently, the well-known $8k level is matching exactly with the triangle upper trendline and if the breakout occurs before May 26 then this should be pretty powerful. Why before May 26? Because if the time goes by then the gap between 8k and the upper trendline gets bigger. Then the candle has to be pretty long to make 2 in 1 breakout. Before that date, the 2 in 1 is pretty powerful and you should wait for it. The break above the triangle upper trendline is the first step to $10,000 and the last step is a break above the $8,489 mark – long-term higher high.
- Bearish Breakout. $7,400 is the key support level. There the strong price level and the triangle bottom trendline are crossing the area. If this level breaks, then we have a break below the triangle and the strong level is also cracked, so it should be a pretty clear confirmation area.
Expect a healthy retracement
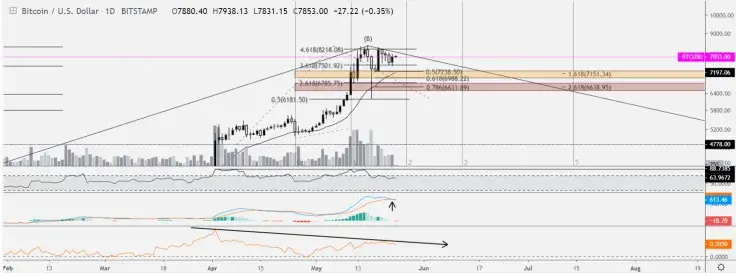
This price chart is one more reminder of what we should really be expecting – a natural price correction. In the daily BTC chart from Cryptonite_traders, BTC is forming a nice M top in price and most indicators showing signs of failure. Bitcoin is due for a healthy retrace to the .382 to eat that wick – that would be a price level somewhere between $6,000-$7,000.
This spike is pure manipulation
The user mc_peewee emphasizes that we are to witness Bitcoin’s real capitulation later this year. He claims that Bitcoin had 5 waves down from our $20k all time high ending at $3,120. That was an 85% retracement, or "A" wave from the ATH. We thought that this was the worst price level, but what if we witness a level much worse, for instance, $834?
The user claims that Bitcoin is painting a 5-3-5 zigzag retracement from ATH. From $20k to $3,120 was roughly an 85% retracement with 5 waves. Then, we had an ABC 5-wave bullish retracement up to around $5k (which could of just been a 3rd wave), and since that time Bitcoin painted another 5 full waves upward (which could be the 5th and final leg).
According to Fibs and EWT, Bitcoin may have completed its final high before true capitulation. Take a look at the RSI, CMF indicator, and the MACD. This might be dreadful. mc_peewee does not believe that Bitcoin can get back to $10K or $12K – that would be evident manipulation.
Price charts are taken from TradingView
 Dan Burgin
 U.Today Editorial Team