With a critical drop to $7,591, Bitcoin disappointed the moon boys and girls of the crypto market. It was expected to raise dust, finally skyrocketing to $10K, but it seems like that won’t happen. So, what to prepare for? How to handle your precious Bitcoin to stay safe and sound in current market conditions? Let Bitcoin price forecasts from TradingView users lead us through the market chaos.
BTC can go up but prepare for either way

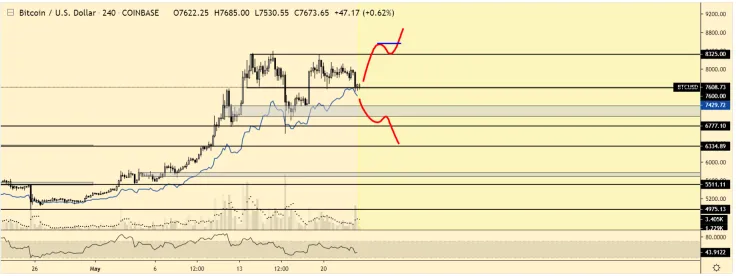
This Bitcoin price chart clearly shows the position of many traders: we should stay prepared for everything. Big_blocker is still in his longs and plans to stop at $7,200.
Gameplan for what to do next? Either add to longs on the breakout to upside or cut and start looking for shorts, if we break to the downside. Have everything ready ahead of time, so don't panic and don’t make emotional decisions.
The ascending triangle is forming

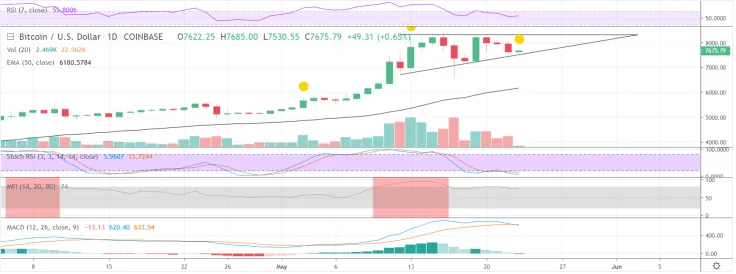
Checking out the 1D price chart, user omgvoy has found out an ascending triangle. That looks promising, but only if we manage to hold on to the current levels and we don't break below the ascending line in any meaningful fashion. That might contradict another prediction from the user:
The double top scenario looks to be playing out although for the time being BTC has found some resistance in the $7,500-7,600 range. Honestly, I don't think this will hold with the main resistance being around the $7,200 mark. There was very clear weakness around the low $8,000's level with the double top, failure to break out to the upside in the symmetrical triangle that followed and massive bearish divergence on RSI and Stoch. Currently, all momentum indicators on various time frames are bearish so buying now would be like trying to catch a falling knife. I think a rise in price at this stage to 10K would have been very unhealthy and would have attracted a ridiculous amount of bears.”
Well, there is still plenty of time to go with this daily candle so let's see how this plays out. We know that Bitcoin tends to be full of surprises.
Bitcoin will fall further

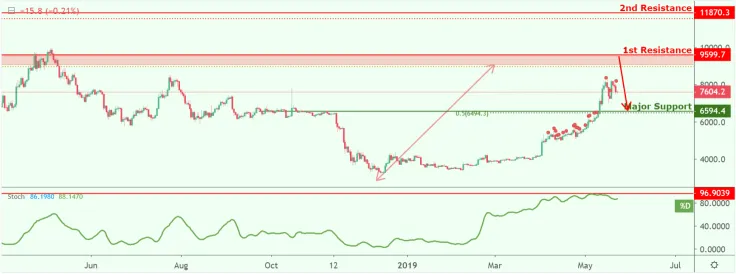
Here are a few technicals to prove this point:
Price is approaching our first resistance (horizontal overlap resistance, 38.2% Fibonacci retracement, 100% Fibonacci extension) where we might see a corresponding drop to our first support level (horizontal pullback support, 50% Fibonacci retracement). Stochastic is also approaching resistance where we might see a corresponding drop in price.
Final thoughts
Since Bitcoin broke the multi-year trend, we can make the assumption is that it will hold. If true, then the above-mentioned ascending triangle may be the pattern that launches prices to the next level. Those waiting for a major correction and lower prices right now may be disappointed.
To reach the long-desired level of $8,400, we should see the price hold above $6,000 or even higher. That would be a good correction down again to test support and then move up. However, this will be a very bullish outcome, which is not likely.
To see a rally above $8,400 Bitcoin needs to be a good volume push. Theoretically, it’s possible, but practically, the market is not ready yet for such prices. The truth might be a disappointment and, depending on the volume, Bitcoin’s path might turn into a bigger drop than expected.
We will rather see a retest of support again first coming week. There’s nothing to do but wait and see.
Price charts are taken from TradingView

 Alex Dovbnya
 Dan Burgin
 Denys Serhiichuk
 Gamza Khanzadaev