Disclaimer: The opinions expressed by our writers are their own and do not represent the views of U.Today. The financial and market information provided on U.Today is intended for informational purposes only. U.Today is not liable for any financial losses incurred while trading cryptocurrencies. Conduct your own research by contacting financial experts before making any investment decisions. We believe that all content is accurate as of the date of publication, but certain offers mentioned may no longer be available.
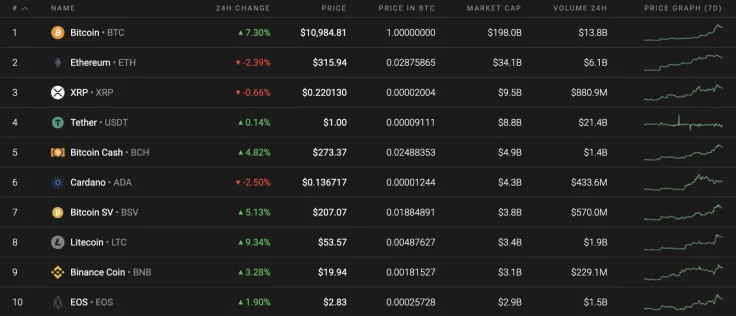
Bitcoin (BTC) has blasted into the stratosphere as a result of the long-term consolidation phase. At the moment, it is trying to fix above the $11,000 mark. Meanwhile, altcoins are not as bullish as they were previously. Litecoin (LTC) is the only coin from the top 10 list that has outperformed the growth of BTC.
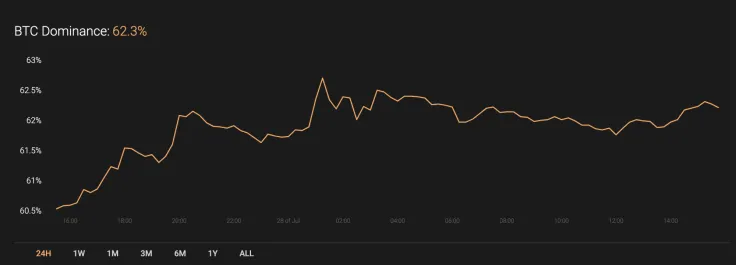
The sharp rise of Bitcoin (BTC) has positively influenced the dominance rate of the leading coin. The market share has risen by almost 2% and is now 62.3%.
Take a look at key statistics for Bitcoin:
-
Name: Bitcoin
Advertisement -
Ticker: BTC
-
Market Cap: $202,365,419,399
-
Price: $10,971.39
Advertisement -
Volume (24h): $36,785,154,955
-
Change (24h): 6.99%
The data is current at press time.
BTC/USD: Can bulls fix above $11,000 by the end of the week?
Buyers continued their gains yesterday and broke through the 2020 high of $10,500 set on February 13. Late at night, strong bullish momentum tested the $11,394 level, setting a new annual high at $11,417.
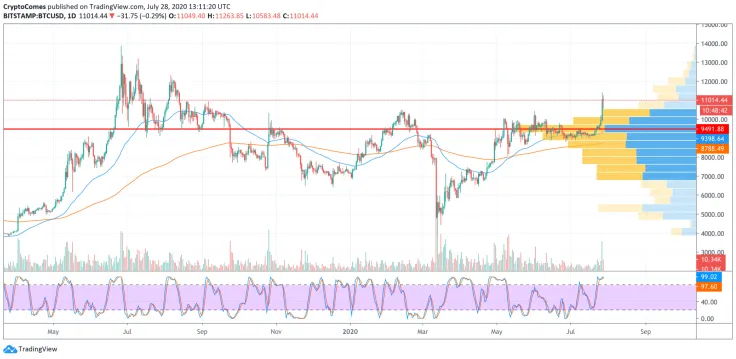
Over the past night, the pair rolled back below $11,000, but in the area of $10,800, the pullback stopped. When the selling volumes are reduced, bulls may try to rise to the psychological level of $12,000. If it is not possible to overcome the resistance of $11,394 today, the pair may return to the zone of the penultimate annual maximum of $10,500.
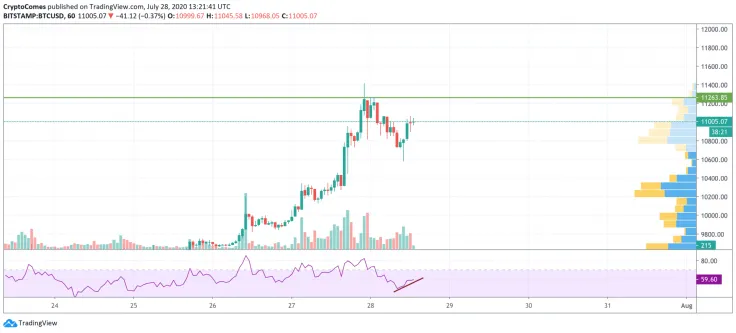
On the hourly chart, Bitcoin (BTC) retains growth potential even though it has blasted by more than 6% over the past 24 hours. The bullish divergence on the RSI indicator confirms buyers' mood. In addition, the selling trading volume is low, which means that sellers have still not seized the initiative. Although bulls are unlikely to surpass yesterday’s peak, a continued rise to the area of $11,260 is quite possible by the end of the day.
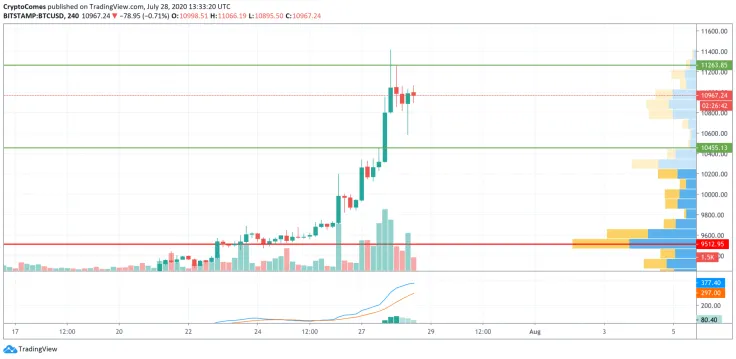
However, on the 4H time frame, sentiments are less positive. The MACD indicator is about to enter the bearish zone and the lack of buyers' interest based on declining trading volume is a signal of a possible correction.

In case Bitcoin (BTC) fails to fix above $11,000 soon, the closest stop is the important "mirror" level around $10,500 that may be attained by the end of the current week.
Bitcoin is trading at $10,962 at press time.
 Dan Burgin
 U.Today Editorial Team