Disclaimer: The opinions expressed by our writers are their own and do not represent the views of U.Today. The financial and market information provided on U.Today is intended for informational purposes only. U.Today is not liable for any financial losses incurred while trading cryptocurrencies. Conduct your own research by contacting financial experts before making any investment decisions. We believe that all content is accurate as of the date of publication, but certain offers mentioned may no longer be available.
Altcoins have risen significantly over the last day while BTC continues to trade around $8,200. Bitcoin SV is the biggest gainer out of the top 10 coins with its price gaining more than 16 percent against the top coin. The overall market capitalization has grown to $223 bln.
Meanwhile, the market share of Bitcoin has dropped to 66.3%.
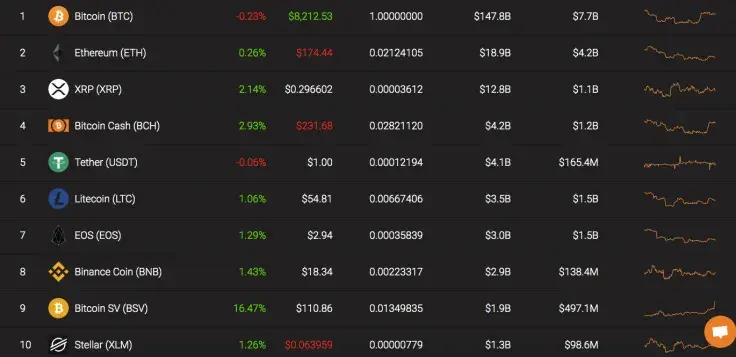
Let's take a quick look at the key indicators of Bitcoin Cash, Litecoin, and XLM.
|
Name |
Ticker Advertisement
|
Market Cap |
Price |
Volume (24h) Advertisement
|
Change (24h) |
|
Bitcoin Cash |
BCH |
$4 202 562 689 |
0,02822275 BTC |
$1 726 612 602 |
3.08% |
|
Litecoin |
LTC |
$3 495 308 208 |
0.00667802 BTC |
$2 771 310 926 |
1.18% |
|
Stellar |
XLM |
$1 284 824 584 |
0.00000778 BTC |
$198 043 753 |
1.55% |
BCH/BTC
Bitcoin Cash is one of the top gainers out of the top 5 coins. Its price has risen by more than 3% over the 24 hours.
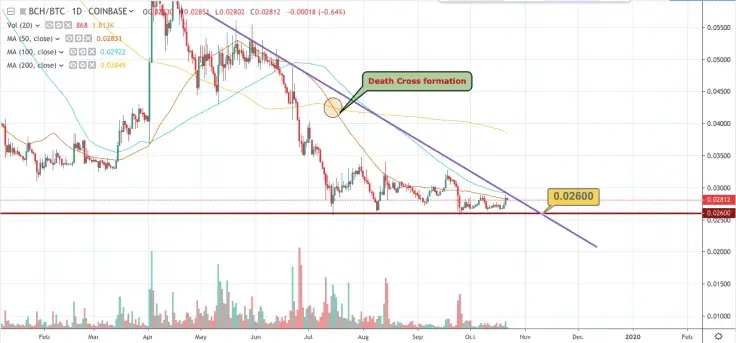
On the daily chart, BCH is trading within the descending channel, following the ’death cross’ pattern formed in the mid-summer of 2019. Currently, there are no signals of a potential trend change in the long-term. The decreasing trading volume indicates the ongoing price decline.
Summing up, the price of BCH might touch the closest support at 0.026 BTC until mid-November.
Bitcoin Cash is trading at 0.02804 BTC at press time.
LTC/BTC
Litecoin has been trapped in a sideways trend since the beginning of September. Its price has gone up by 1.18% over the last day.
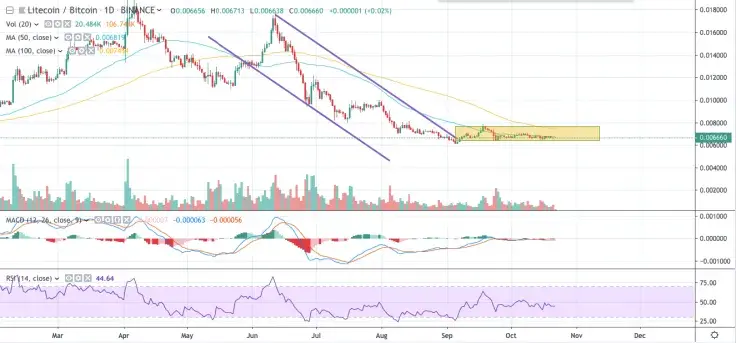
The rate of ’digital silver’ is located under the MA 50 and MA 100, confirming the decline. However, bulls are still standing their ground, holding the price in the yellow range corridor for more than one month. In terms of the nearest price forecast, Litecoin is likely to trade above 0.006 BTC within the next few weeks.
Such a scenario is backed by the neutral MACD and RSI indicators. Moreover, the trading volume has remained unchanged for a few months.
Litecoin is trading at 0.00666 BTC at press time.
XLM/BTC
Although the price of XLM has increased by only 1.55% over the last day, its price has risen by almost 50% since mid-September.
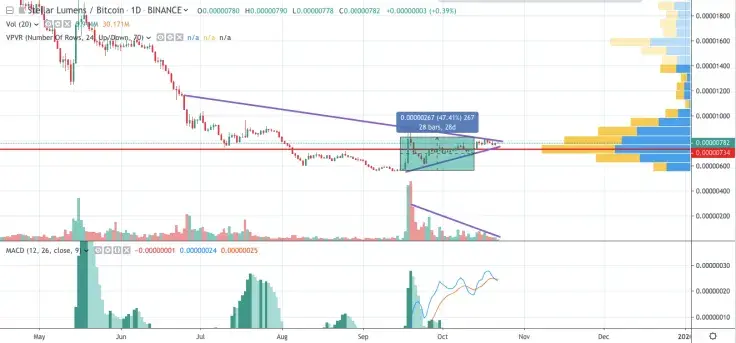
On the daily chart, XLM is located within the triangle pattern with a possible breakout downward. Such a scenario is supported by the declining trading volume, which has been going down since the end of September. Moreover, the blue line of the MACD indicator has crossed the red one which means the trend change. Respectively, the rate of XLM is about to sink below 700 satoshis in the short-term.
XLM is trading at 0.00000783 BTC at press time.
 Dan Burgin
 U.Today Editorial Team